
Q4 2022 Southern California Real Estate Market Update

The following analysis of select counties of the Southern California real estate market is provided by Windermere Real Estate Chief Economist Matthew Gardner. We hope that this information may assist you with making better-informed real estate decisions. For further information about the housing market in your area, please don’t hesitate to contact your Windermere Real Estate agent.
Regional Economic Overview
Employment growth in Southern California continues to slow, with only 33,400 jobs added over the past three months. Annual growth also slowed: only 141,100 new jobs were added, which is down from 347,700 added between September 2021 and September 2022. Total employment in the counties covered by this report is still 305,300 shy of the region’s pre-pandemic peak. Los Angeles County still has the largest shortfall (-310,000), followed by Orange County (-36,800) and San Diego County (-19,500). Employment levels in the Riverside and San Bernardino markets remain well above pre-pandemic levels. The region’s unemployment rate in November was 4%, down from 5.4% a year ago. The lowest rates were in Orange County (3%) and San Diego County (3.3%).
Southern California Home Sales
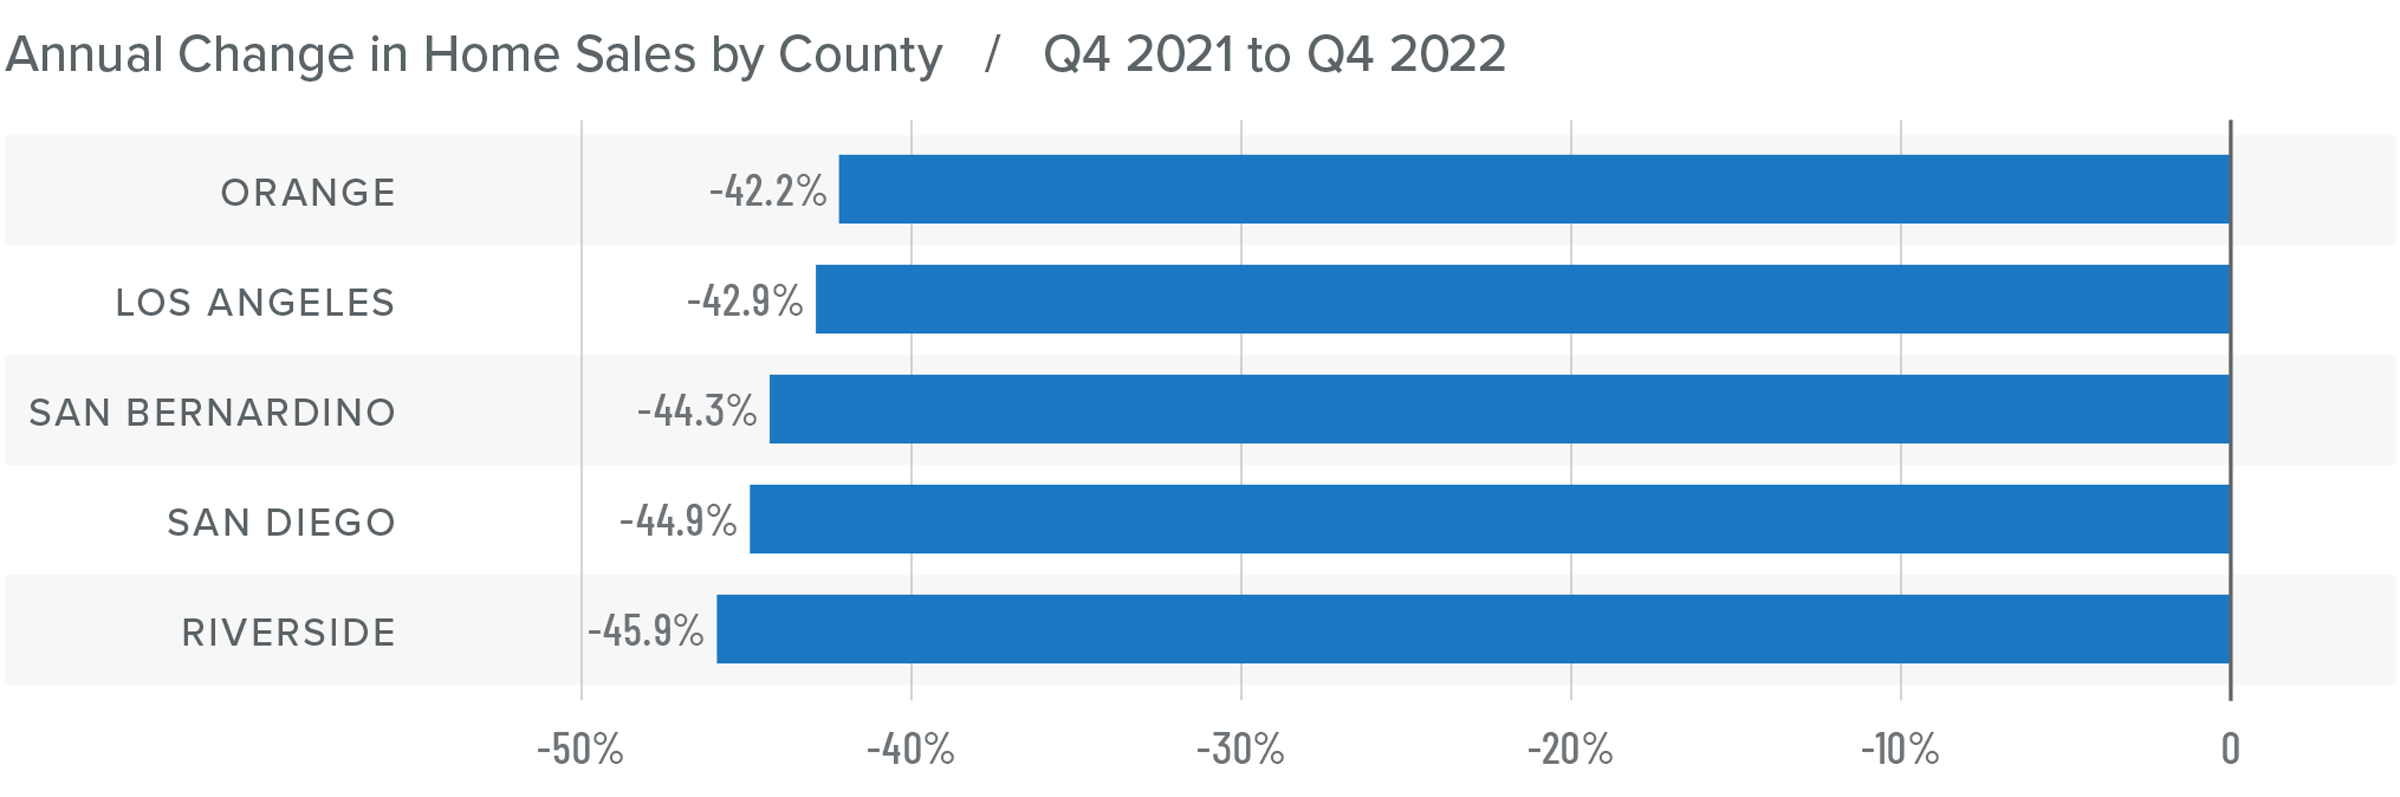
❱ In the final quarter of 2022, 28,953 homes sold. This is 43.9% lower than the same period the year prior and down 24.5% compared to the third quarter of 2022.
❱ Pending home sales, which are an indicator of future closings, were down 30% from the third quarter, suggesting that sales activity in the first quarter of this year may also be down.
❱ On a percentage basis, sales fell the most in Riverside County, but all markets pulled back significantly. Compared to the third quarter, sales were down 24.5%, or 9,400 units.
❱ Lower number of sales can be attributed to more listings in the market, which were up 83.5% year over year, and higher mortgage rates, which make homes less affordable.
Southern California Home Prices
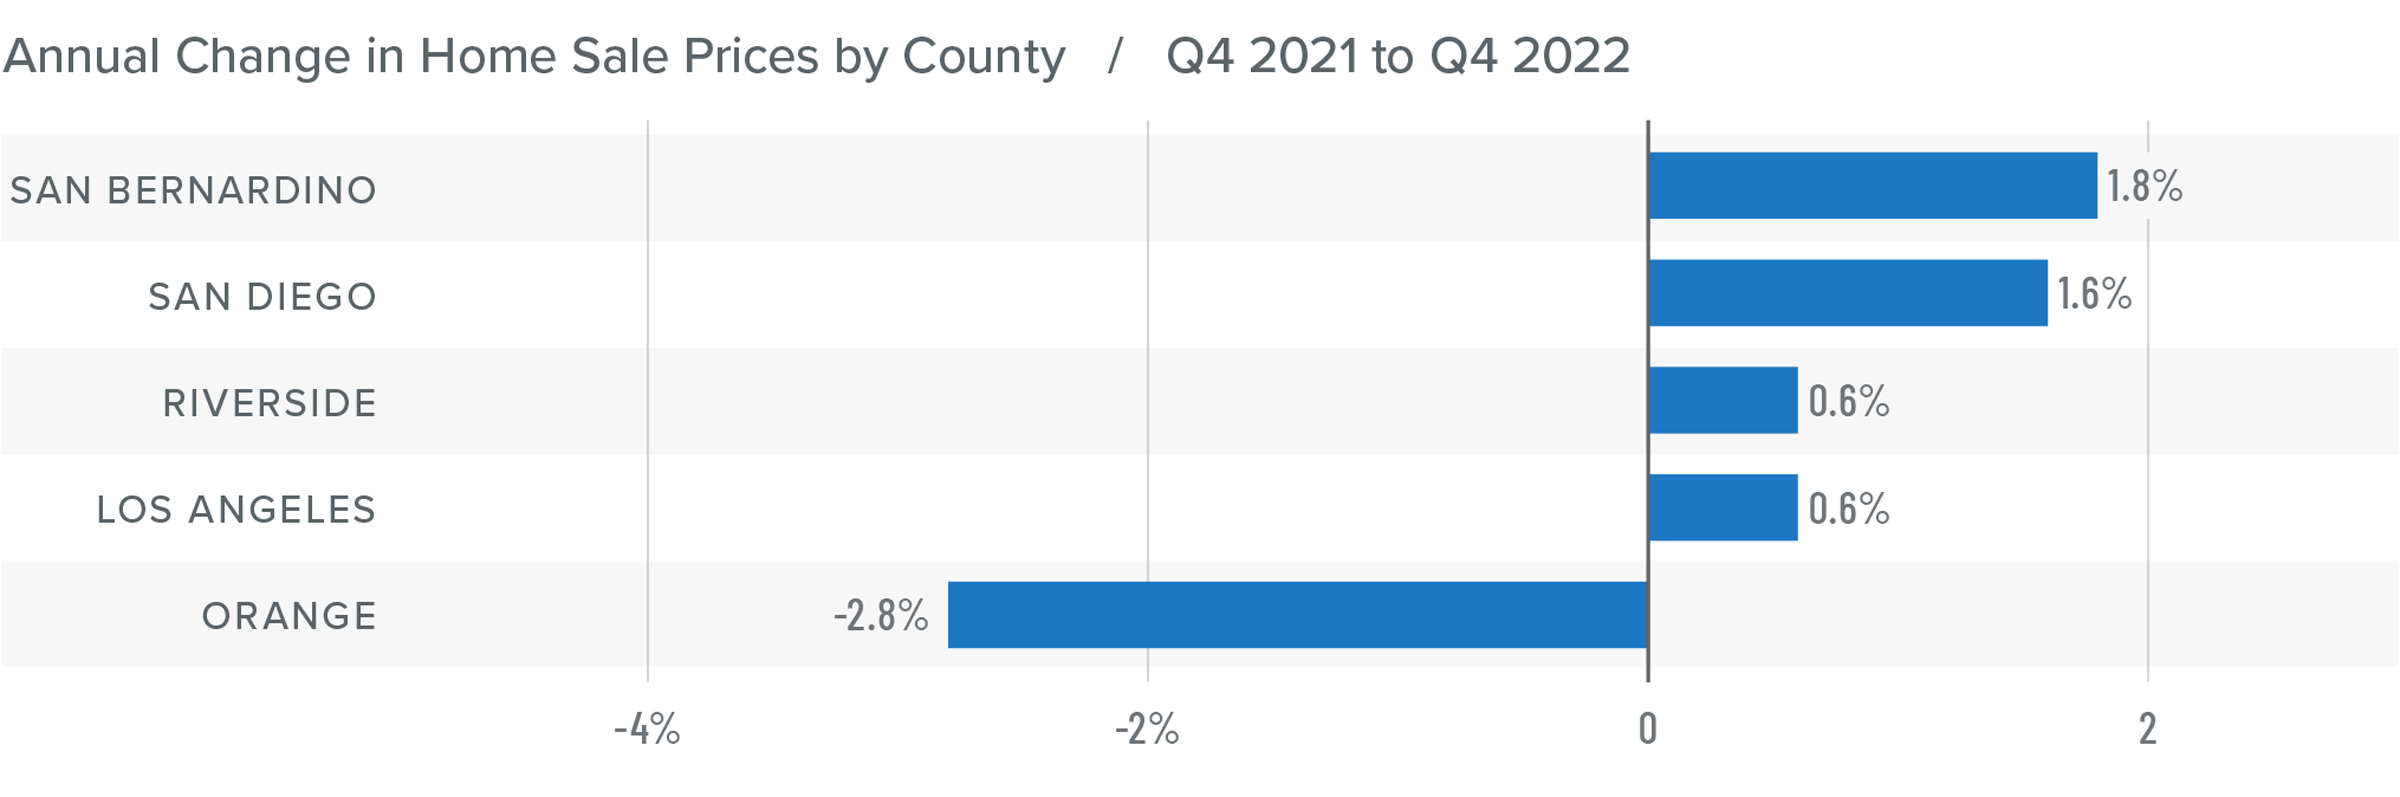
❱ Fourth quarter home sale prices were .7% higher than the same period the prior year but were 2.5% lower than in the third quarter of 2022.
❱ Mortgage rates, which peaked in October, have impacted both the number of sales and prices. Median listing prices were down 4.9%, which indicates that sellers have been adjusting their expectations, but I believe they will fall further before stability in the market is restored.
❱ The region had very modest price growth in all markets other than Orange County, where prices fell 2.8%. Compared to the third quarter of 2022, prices were lower across all markets other than Los Angeles County, where they rose .2%.
❱ Mortgage rates have started to pull back. If this continues, I am hopeful that the second half of 2023 will be more active, resulting in rising sales and home prices.
Mortgage Rates
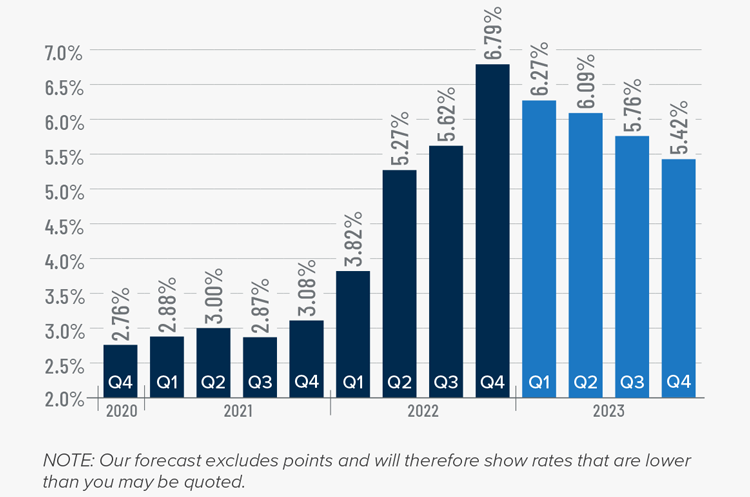
Rates rose dramatically in 2022, but I believe that they have now peaked. Mortgage rates are primarily based on the prices and yields of bonds, and while bonds take cues from several places, they are always impacted by inflation and the economy at large. If inflation continues to fall, as I expect it will, rates will continue to drop.
My current forecast is that mortgage rates will trend lower as we move through the year. While this may be good news for home buyers, rates will still be higher than they have become accustomed to. Even as the cost of borrowing falls, home prices in expensive markets will probably fall a bit more to compensate for rates that will likely hold above 6% until early summer.
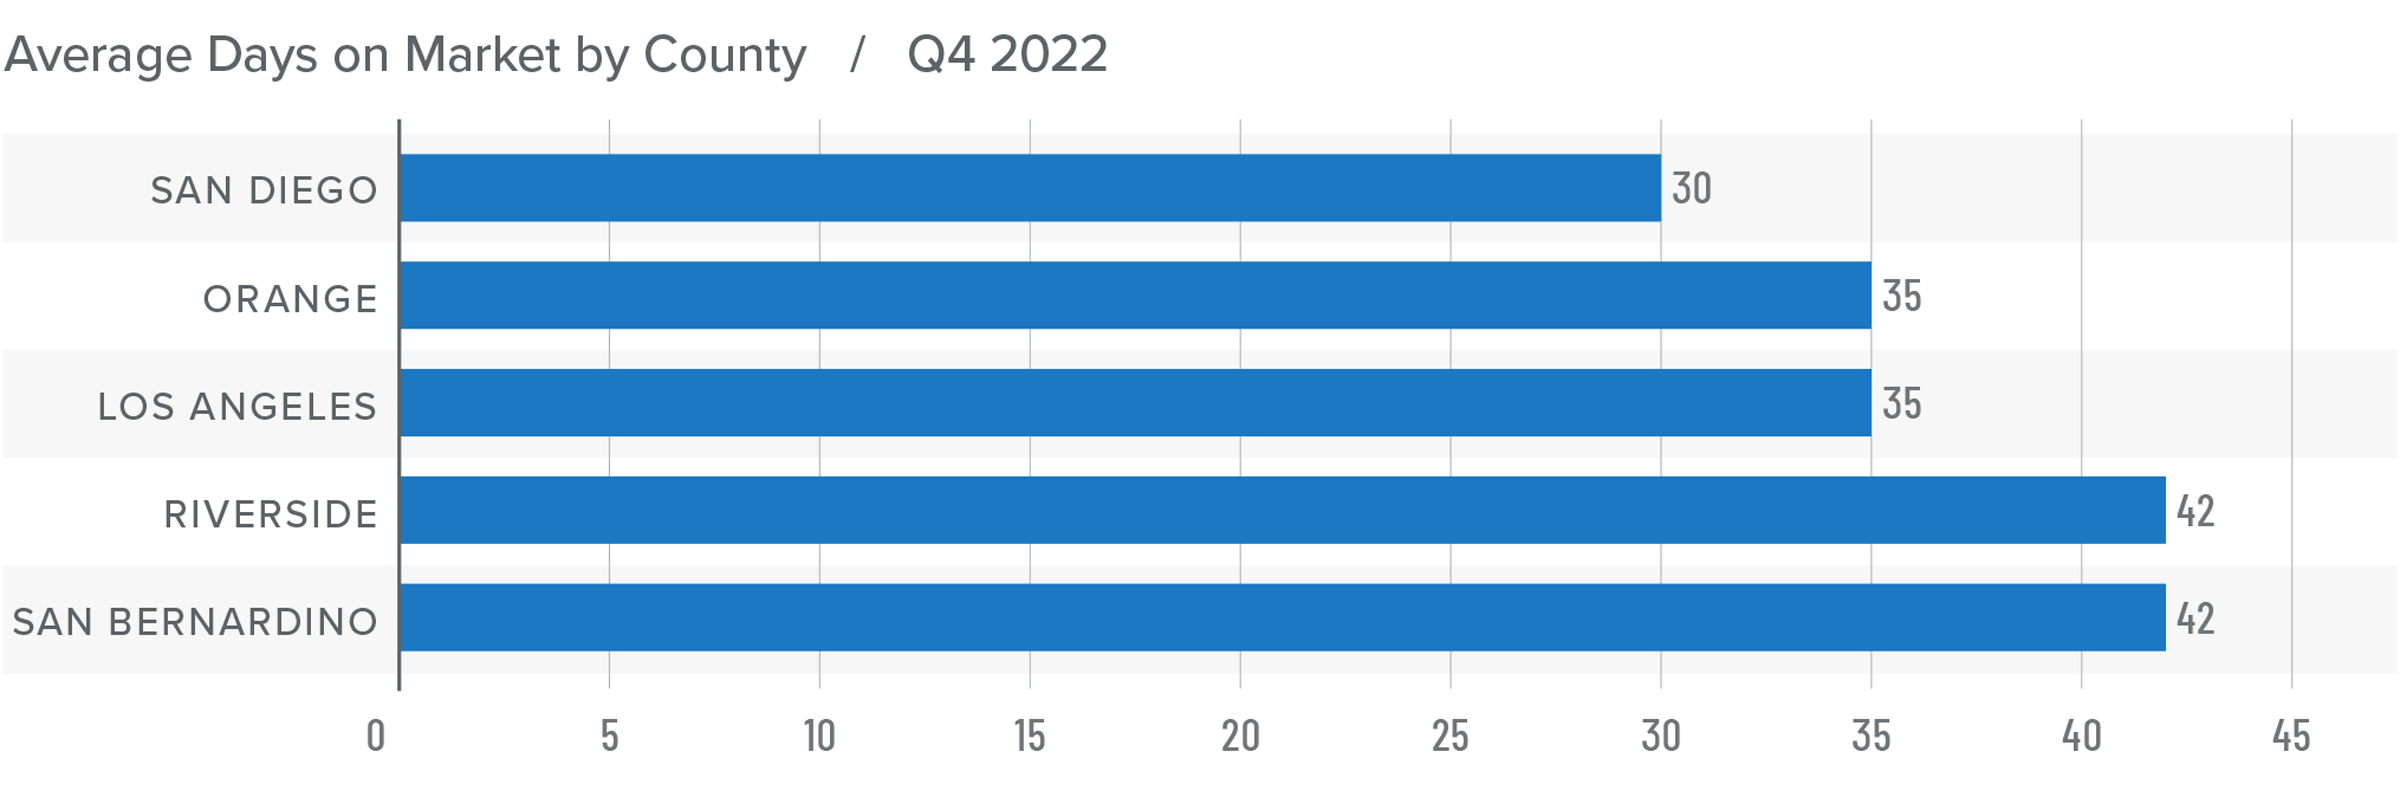
Southern California Days on Market
❱ In the final quarter of 2022, the average time it took to sell a home in the region was 37 days, which was 15 more than the same period the year prior and 11 more than in the third quarter of 2022.
❱ Compared to the third quarter of 2022, market time rose in all counties covered by this report.
❱ Homes in San Diego County continue to sell at a faster rate than other markets in the region, but market time increased in all counties year over year.
❱ More choice and higher mortgage rates appear to be sidelining some buyers. Whether they resume their search for a home in the spring may depend on the direction of mortgage rates and whether prices start to stabilize.
Conclusions
This speedometer reflects the state of the region’s real estate market using housing inventory, price gains, home sales, interest rates, and larger economic factors.
Job growth has slowed, which may be at least partly attributable to businesses expecting to see the economy slow as we move through this year. The housing market is very susceptible to economic turbulence. This, combined with higher financing costs and softening prices, has caused a lull in the market.

There is no doubt that regional home values are resetting following the frenetic market during the pandemic when mortgage rates were artificially low. I expect prices to move modestly lower this spring before stabilizing and starting to rise again in the second half of the year. All things considered, I have moved the needle to a neutral position, favoring neither buyers nor sellers.
About Matthew Gardner

As Chief Economist for Windermere Real Estate, Matthew Gardner is responsible for analyzing and interpreting economic data and its impact on the real estate market on both a local and national level. Matthew has over 30 years of professional experience both in the U.S. and U.K.
In addition to his day-to-day responsibilities, Matthew sits on the Washington State Governors Council of Economic Advisors; chairs the Board of Trustees at the Washington Center for Real Estate Research at the University of Washington; and is an Advisory Board Member at the Runstad Center for Real Estate Studies at the University of Washington where he also lectures in real estate economics.

Windermere Tower Properties Shows the Love to Riverside Educators and Small Businesses.

Windermere Tower Properties celebrated Valentine’s Day with the launch of the “Show the love” campaign to honor and recognize local educators for their commitment to students in our community. Throughout the pandemic it has become apparent that our local schools are the center of our community and essential, for not only the development of our youth, but also for our local economy to thrive. Teachers, cafeteria workers, custodians and all school staff have been versatile in meeting the needs of our students and our community, putting others before themselves. Since the beginning of the pandemic educators have pivoted to adjust to public health mandates while still focusing on the goal of creating learning environments for our students to succeed.
The entire team at Windermere Tower Properties wanted local educators to know we value their commitment and empathize with the social and emotional toll the pandemic has had on their profession. The “Show the Love” campaign allowed the Realtors to partner with their brokerage and select a local school to buy lunch or a treat for their entire staff from an area small business. This successful campaign reminded our local educators that they are loved and supported small business owners and our local economy.
On February 14th the Realtors at Windermere Tower Properties handed out more than 900 lunches or treats to more than 15 elementary school sites throughout Riverside including: Pachappa, La Granada, Longfellow, Lake Hills, Alcott, Madison, Jefferson, Franklin, Kennedy, Twain, Hawthorne, Washington, Foothill, Twin Hills, Woodcrest, Woodrest Christian, and Springs Charter School. Local eateries like Sub Station, Antoines, DeMatteo’s, Northgate Gonzales Market, Upper Crust, Riverside Cookie Shop, Cactus Cantina, Crumbl, and local Girl Scout troops were some of the area businesses that were supported. “The staff in the front office were so overwhelmed with gratitude,” said Realtor Associate, Heidi Carter.
“The receptionist told me since the pandemic we haven’t celebrated holidays the same way and often times offices were bare and didn’t look like they were celebrating the holiday at all. They really needed this.” Carter said.
Colette Lee, co-owner of Windermere Tower Properties, stated, “We are really happy this campaign turned our so well in its first effort. We want to “show the love” every year and support even more schools next time around.”
For more information contact Windermere Tower Properties at (951) 369-8002 or visit www.windermeretower.com

Q2 Southern California Real Estate Market Update | Gardner Report
The following analysis of the Southern California real estate market is provided by Windermere Real Estate Chief Economist Matthew Gardner. We hope that this information may assist you with making better-informed real estate decisions. For further information about the housing market in your area, please don’t hesitate to contact your Windermere agent.
ECONOMIC OVERVIEW
Unexpectantly, the counties covered by this report — Los Angeles, San Diego, San Bernardino, Orange, and Riverside — saw total employment drop by 10,700 jobs (-0.1%) year-over-year. However, while Los Angeles and Orange counties reported declines, the smaller Riverside, San Bernardino, and San Diego counties saw employment rise. This is a significant reversal from the growth rates that have been in place for quite some time and may be due to re-benchmarking, which is when the government compares its sample to broader, historic data. I suspect that this is an anomaly and will reverse course, but I will continue to follow employment data closely as we move through the balance of the summer to see if this is a trend.
Over the past year, the unemployment rate in Southern California dropped from 3.6% to 3.4%, which further points to a data issue rather than a new trend that we need to be concerned about. I’ll know more when we publish the third quarter Gardner Report.
HOME SALES
- There were 49,996 home sales in the second quarter of 2019. This was a drop of 3.6% from the same period in 2018 but 46.4% higher than the first quarter of this year.
- Pending home sales (an indicator of future closings) rose by 3.7% compared to a year ago, suggesting that total sales in the third quarter are likely to be an improvement over current levels.
- Following a trend that started last fall, home sales fell across the board. The most noticeable decline was again in San Bernardino County, which fell by 6.7%. The smallest drop was in the relatively affordable Riverside County.
- There was an average of 40,174 active listings in the second quarter — up 13.1% from a year ago and 6.7% higher than in the first quarter of the year.

HOME PRICES
- Year-over-year, average prices in the region were flat but were 5.3% higher than in the first quarter of 2019.
- As stated above, affordability issues continue in most Southern California markets and this will likely lead price growth to taper.
- Price growth in second quarter was mixed. Riverside County continues to have the greatest annual appreciation (+4.1%). Price gains were also seen in San Bernardino and San Diego counties. There were modest drops in average sale prices in Los Angeles and Orange counties, but this is not of great concern at the present time. That said, it is clear that affordability issues are present in these markets.
- On a year-over-year basis, I still expect to see home prices continue to rise, but this likely only due to the very competitive mortgage rates. If rates move higher, this will have an impact on price growth.


DAYS ON MARKET
- The average time it took to sell a home in the region was 44 days. This is an 8-day increase over the second quarter of 2018 but is down 9 days compared to the first quarter of 2019.
- All markets saw the time it took to sell a house increase compared to the second quarter of 2018.
- Homes in San Diego County continue to sell at a faster rate than other markets in the region. In the second quarter it took an average of just 29 days to sell a home. I would note that this is 5 more days than it took a year ago.
- Market time is increasing, which may concern some, but it is simply a move back to historic averages.

CONCLUSIONS
The speedometer reflects the state of the region’s real estate market using housing inventory, price gains, home sales, interest rates, and larger economic factors.
Rising inventory levels, and affordability concerns in many markets will likely lead to slower price growth as we move through 2019. That said, mortgage rates are still very attractive, and this can offset affordability issues to some degree.
Given rising inventories and slower price growth, I have moved the needle just a little more toward buyers, though it still remains a sellers market.

As Chief Economist for Windermere Real Estate, Matthew Gardner is responsible for analyzing and interpreting economic data and its impact on the real estate market on both a local and national level. Matthew has over 30 years of professional experience both in the U.S. and U.K.
In addition to his day-to-day responsibilities, Matthew sits on the Washington State Governors Council of Economic Advisors; chairs the Board of Trustees at the Washington Center for Real Estate Research at the University of Washington; and is an Advisory Board Member at the Runstad Center for Real Estate Studies at the University of Washington where he also lectures in real estate economics.

![]()

Windermere Living - Spring 2019
In this Spring 2019 issue of the Windermere Living magazine you will learn about decluttering your home, edible flowers, five talented designers creative processes, and much more.
Windermere Living is an exclusive listings magazine published by Windermere Real Estate. Read the online version by clicking on the image below.

Q1 Southern California Real Estate Market Update | Gardner Report
The following analysis of the Southern California real estate market is provided by Windermere Real Estate Chief Economist Matthew Gardner. We hope that this information may assist you with making better-informed real estate decisions. For further information about the housing market in your area, please don’t hesitate to contact your Windermere agent.
ECONOMIC OVERVIEW
The counties covered by this report — Los Angeles, San Diego, San Bernardino, Orange, and Riverside — added 165,000 new jobs between February 2018 and February 2019. This represents an annual growth rate of 1.7%. In the same timeframe, the unemployment rate dropped from 4.4% to 3.9%. Employment growth in Southern California picked up a little in the late winter. Los Angeles County led the way, adding 96,500 new jobs. My 2019 forecast for employment in Southern California is for continued growth at around 1.5%.
HOME SALES
- There were 34,142 home sales in the first quarter of 2019. This was a drop of 12.4% from the same period in 2018 and 13.9% lower than the final quarter of last year
- Pending home sales (an indicator of future closings) were just 2.8% lower than during the same period a year ago, but down 18% compared to the fourth quarter of 2018. This suggests that second-quarter sales are likely to disappoint.
- Home sales dropped across the board, but the most noticeable decline was again in Orange County, which fell by 15.2%. This drop is probably temporary and was more than likely driven by the 49% increase in inventory and high home prices. The smallest drop was in the more affordable Riverside County.
- There was an average of 37,641 active listings in the first quarter — up 30.5% from a year ago.

HOME PRICES
 Year-over-year, average prices in the region rose a very modest .3% and were 2.4% lower than in the fourth quarter of 2018.
- Affordability remains an issue in most of the Southern California counties contained in this report, which, in concert with growing inventory, will likely continue to limit home price growth.
- Price growth was varied. Riverside County showed the greatest annual appreciation (+4.3%). Average home prices dropped 1.4% in Orange County.
- On a year-over-year basis, I expect to see home prices continue to rise through 2019, but the rate of growth will be more modest than the market has seen in several years.

DAYS ON MARKET
- The average time it took to sell a home in the region was 53 days. This is a 10-day increase compared to the first quarter of 2018, and eight days more than in the fourth quarter of 2018.
- All markets saw an increase in the time it took to sell a house in the first quarter of this year compared to both the first and fourth quarters of 2018.
- Homes in San Diego County continue to sell at a faster rate than other markets in the region. In the first quarter, it took an average of 37 days to sell a home, which is eight days more than it took a year ago.
- Market time is increasing, which may concern some; however, it is simply a move back to normal averages.

CONCLUSIONS
 The speedometer reflects the state of the region’s real estate market using housing inventory, price gains, home sales, interest rates, and larger economic factors.
The Southern California economy saw a bit of a boost in early 2019, which is good news. But rising inventory levels and low affordability in many markets will lead to slower price growth. Affordability remains a significant issue and I will be watching proposed legislation, such as Senate Bill 50, to see whether there is enough interest in addressing this obstacle to home ownership.
Rising inventories and slower price growth has led me to move the needle a little further toward buyers.
As Chief Economist for Windermere Real Estate, Matthew Gardner is responsible for analyzing and interpreting economic data and its impact on the real estate market on both a local and national level. Matthew has over 30 years of professional experience both in the U.S. and U.K.
In addition to his day-to-day responsibilities, Matthew sits on the Washington State Governors Council of Economic Advisors; chairs the Board of Trustees at the Washington Center for Real Estate Research at the University of Washington; and is an Advisory Board Member at the Runstad Center for Real Estate Studies at the University of Washington where he also lectures in real estate economics.

![]()
2018 in Review – Here’s to a Wonderful 2019!
As 2018 comes to a close, we’re reflecting on how lucky we are to have shared the year with you during each exciting new chapter in your lives! To our clients, thank you for trusting us, for your referrals and for the opportunity to serve you in 2018! We had the opportunity of serving over 500 families. We truly appreciate your support and trust in Windermere Tower Properties!
If 2019 is YOUR year to buy your dream home, to purchase an investment property or buy your first home – we would love the opportunity to help you!
Wishing you a happy new year, and a great year ahead!
Sincerely,

Windermere Tower Properties


7 Reasons To List Your House For Sale This Holiday Season
Every year at this time there are many homeowners who decide to wait until after the holidays to list their homes for the first time, while others who already have their homes on the market decide to take them off until after the holidays.
Here are seven great reasons not to wait:
- Relocation buyers are out there. Many companies are still hiring throughout the holidays and need their new employees in their new positions as soon as possible.
- Purchasers who are looking for homes during the holidays are serious buyers and are ready to buy now.
- You can restrict the showings on your home to the times you want it shown. You will remain in control.
- Homes show better when decorated for the holidays.
- There is minimal competition for you as a seller right now. Inventory of homes for sale traditionally slows in the late fall, early winter.
- The desire to own a home doesn’t stop when the holidays come. Buyers who were unable to find their dream homes during the busy spring and summer months are still searching!
- The supply of listings increases substantially after the holidays. Also, in many parts of the country, new construction will continue to surge and reach new heights which will lessen the demand for your house in 2019.
Waiting until after the holidays to sell your home probably doesn’t make sense.
Source: Keeping Current Matters

Tips to Transition Your Home From Summer to Fall
Oh my, fall decor is where it's at! Pumpkins and leaves and wreaths and candles, there's no end to the fun in fall decor! There are many ways to decorate your home in a tasteful and festive way for fall.
Here are a few tips on how to transition from summer to fall décor!
1. Incorporate warm tones – change out your blankets and throw pillows with fall colors (browns, mustard yellows, burgundies)
2. Trade out your fresh summer scents for fall scents (pumpkin, cinnamon, apple cider) - Light candles and let the glow set the fall mood. Candles are an absolute favorite to set the tone of the holiday season. Especially pumpkin spice and leaves for fall.
3. Decorate with natural elements – seasonal fruit (pears, pumpkins, apples, squash) and pine cones.
4. Purchase seasonal plants such as mums and hydrangea and place them outside your front door/porch.
5. Change out your fabrics and textures – textured textiles such as burlap, tweed, and herringbone.
I hope you enjoy decorating for fall as much as we do! Keep it simple and classic and you will not be disappointed!


Why Fall Is A Great Time To Buy A Home!
Here are four great reasons to consider buying a home today instead of waiting.
1. Prices Will Continue to Rise
CoreLogic’s latest Home Price Insights report reveals that home prices have appreciated by 6.2% over the last 12 months. The same report predicts that prices will continue to increase at a rate of 5.1% over the next year.
Home values will continue to appreciate for years. Waiting no longer makes sense.
2. Mortgage Interest Rates Are Projected to Increase
Freddie Mac’s Primary Mortgage Market Survey shows that interest rates for a 30-year mortgage have already increased by half of a percentage point, to around 4.5% in 2018. Most experts predict that rates will rise over the next 12 months. The Mortgage Bankers Association, Fannie Mae, Freddie Mac and the National Association of Realtors are in unison, projecting that rates will increase by half a percentage point to around 5.1% by this time next year.
An increase in rates will impact your monthly mortgage payment. A year from now, your housing expense will increase if a mortgage is necessary to buy your next home.
3. Either Way, You Are Paying a Mortgage
There are some renters who have not yet purchased homes because they are uncomfortable taking on the obligation of a mortgage. Everyone should realize that unless you are living with your parents rent-free, you are paying a mortgage – either yours or your landlord’s.
As an owner, your mortgage payment is a form of ‘forced savings’ that allows you to build equity in your home which you can then tap into later in life. As a renter, you guarantee your landlord is the person building that equity.
Are you ready to put your housing cost to work for you?
4. It’s Time to Move on with Your Life
The ‘cost’ of a home is determined by two major components: the price of the home and the current mortgage rate. It appears that both are on the rise.
But what if they weren’t? Would you wait?
Look at the actual reason you are buying and decide if it is worth waiting. Whether you want to have a great place for your children to grow up, you want your family to be safer, or you just want to have control over renovations, maybe now is the time to buy.
If the right thing for you and your family is to purchase a home this year, buying sooner rather than later could lead to substantial savings.
Source: Keeping Current Matters

Southern California Real Estate Market Update - Q2 2018

The following analysis of the Southern California real estate market is provided by Windermere Real Estate Chief Economist Matthew Gardner. We hope that this information may assist you with making better-informed real estate decisions. For further information about the housing market in your area, please don’t hesitate to contact your Windermere agent.
ECONOMIC OVERVIEW
The counties covered by this report—Los Angeles, San Diego, San Bernardino, Orange, and Riverside—added 110,200 new jobs between May 2017 and May 2018. As a result, the unemployment rate dropped from 4.2% to 3.6%. Employment growth in Southern California continues to outperform the nation as a whole, and I am confident this will continue as we move through the balance of the year.
HOME SALES ACTIVITY
- There were 51,320 home sales in the second quarter of 2018. This was 6.8% lower than the same period in 2017 but 32.6% higher than the first quarter of this year.
- Pending home sales (an indicator of future closings) were 3.2% lower than during the same period a year ago, which suggests that third quarter closings may not show much improvement.
- Home sales dropped across the board. The most noticeable decline was in San Diego County, which fell 8.8%. I continue to believe that the decline in sales is directly related to the very low levels of inventory.
- There was an average of 35,238 active listings in the second quarter—well below what is needed to get to a balanced market.

HOME PRICES
- Year-over-year, average prices in the region rose by 7% and were 5.6% higher than in the first quarter of 2018.
- Affordability continues to be an issue, which, in concert with limited inventory, is pushing home prices higher. New construction activity is not meeting the needs of new households, which puts further pressure on home prices.
- Price increases across the region were fairly level, with Orange County showing the greatest annual appreciation in values (+8.1%). The slowest appreciation was in San Diego County, which still saw a respectable 6.6% increase.
- Based on the data in this report, I believe it is highly likely that prices will continue rising at above-average rates for at least the balance of 2018.


DAYS ON MARKET
- The average time it took to sell a home in the region was 37 days. This is a drop of four days compared to the second quarter of 2017, and seven fewer days than in the first quarter of this year.
- The biggest drop in days on market was in San Bernardino County, where it took six fewer days to sell a home compared to the same period last year.
- Homes in San Diego County continue to sell at a faster rate than other markets in the region. In the second quarter, it took an average of only 24 days to sell a home, which is one day less than it took a year ago.
- All five counties saw a drop in the amount of time it took to sell a home compared to the second quarter of 2017.

CONCLUSIONS
The speedometer reflects the state of the region’s real estate market using housing inventory,
price gains, home sales, interest rates, and larger economic factors.
The Southern California economy continues to add jobs at a very healthy rate, which increases demand for all housing types. Mortgage rates—although rising— are still very favorable when compared to historic averages, and low inventory continues to drive prices higher. The number of homes for sale in the region remains well below the levels needed for a balanced market. Given all of these factors, I have moved the needle a little more in favor of sellers.


Mr. Gardner is the Chief Economist for Windermere Real Estate, specializing in residential market analysis, commercial/industrial market analysis, financial analysis, and land use and regional economics. He is the former Principal of Gardner Economics, and has more than 30 years of professional experience both in the U.S. and U.K.