
The following analysis of select counties of the Southern California real estate market is provided by Windermere Real Estate Chief Economist Matthew Gardner. We hope that this information may assist you with making better-informed real estate decisions. For further information about the housing market in your area, please don’t hesitate to contact your Windermere Real Estate agent.
Regional Economic Overview
Employment growth in Southern California continues to slow, with only 33,400 jobs added over the past three months. Annual growth also slowed: only 141,100 new jobs were added, which is down from 347,700 added between September 2021 and September 2022. Total employment in the counties covered by this report is still 305,300 shy of the region’s pre-pandemic peak. Los Angeles County still has the largest shortfall (-310,000), followed by Orange County (-36,800) and San Diego County (-19,500). Employment levels in the Riverside and San Bernardino markets remain well above pre-pandemic levels. The region’s unemployment rate in November was 4%, down from 5.4% a year ago. The lowest rates were in Orange County (3%) and San Diego County (3.3%).
Southern California Home Sales
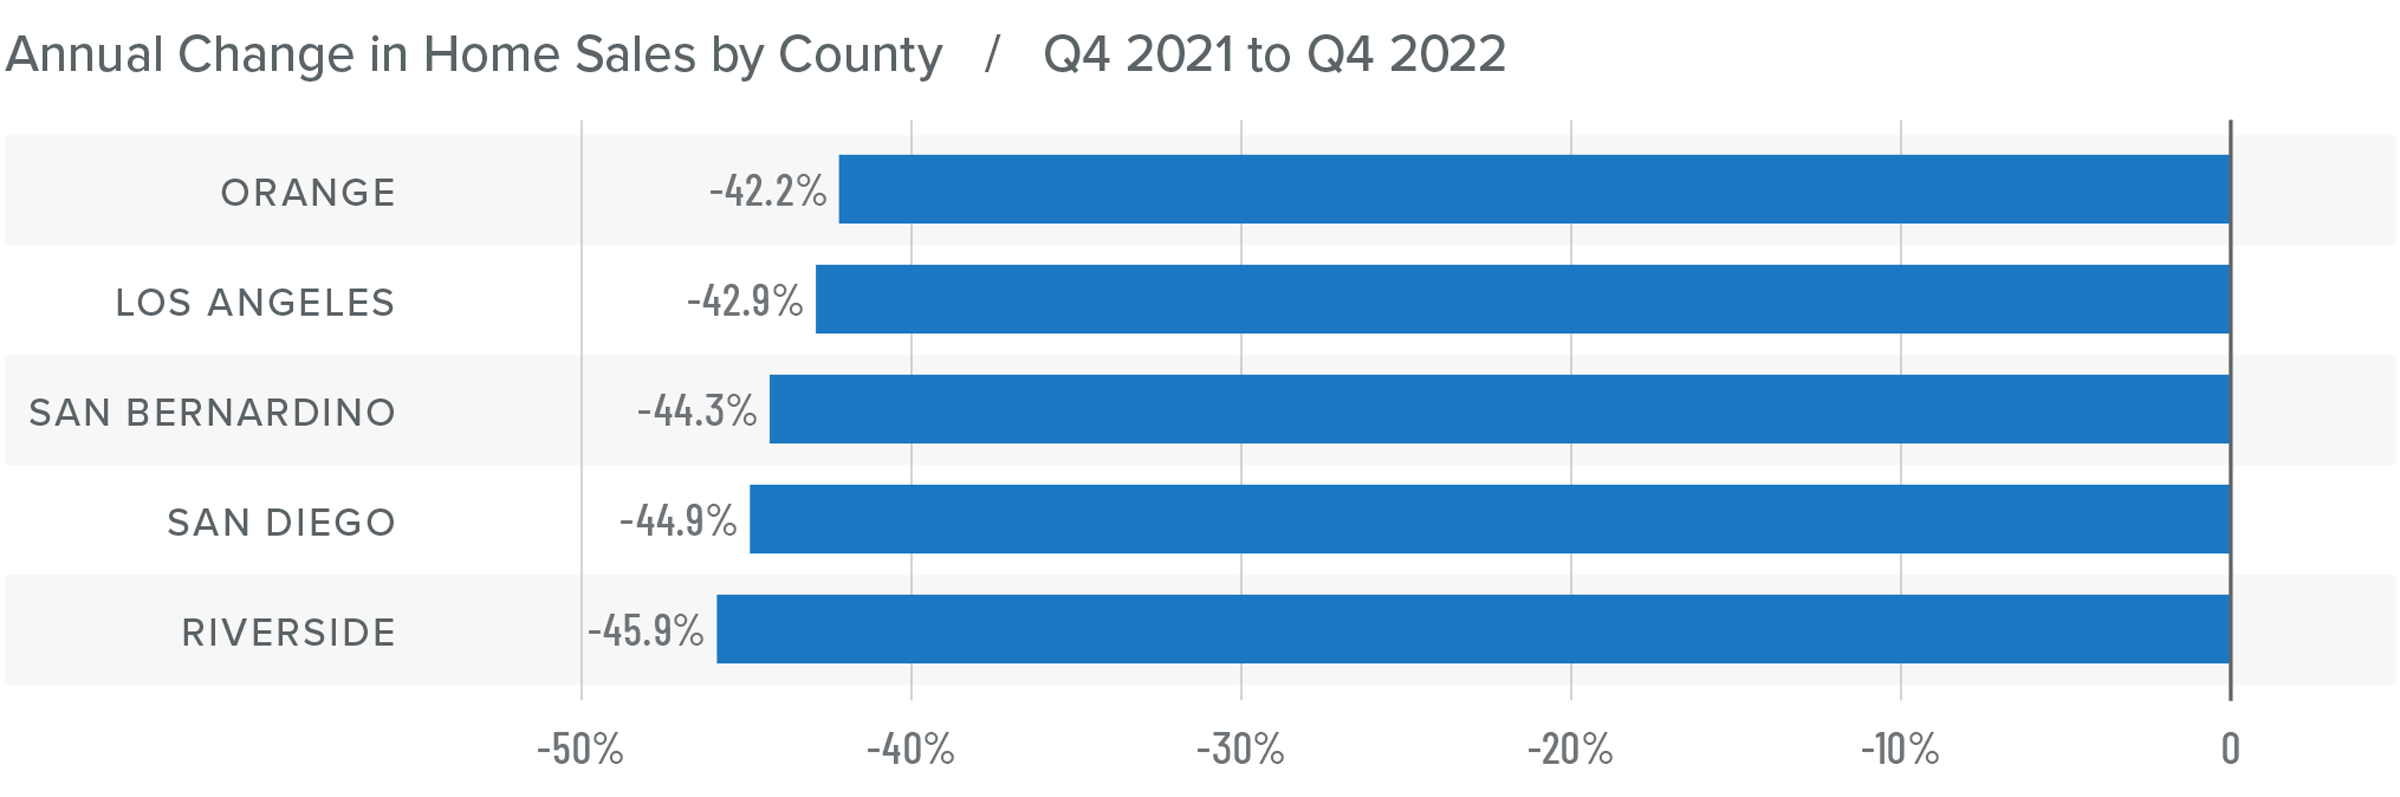
❱ In the final quarter of 2022, 28,953 homes sold. This is 43.9% lower than the same period the year prior and down 24.5% compared to the third quarter of 2022.
❱ Pending home sales, which are an indicator of future closings, were down 30% from the third quarter, suggesting that sales activity in the first quarter of this year may also be down.
❱ On a percentage basis, sales fell the most in Riverside County, but all markets pulled back significantly. Compared to the third quarter, sales were down 24.5%, or 9,400 units.
❱ Lower number of sales can be attributed to more listings in the market, which were up 83.5% year over year, and higher mortgage rates, which make homes less affordable.
Southern California Home Prices
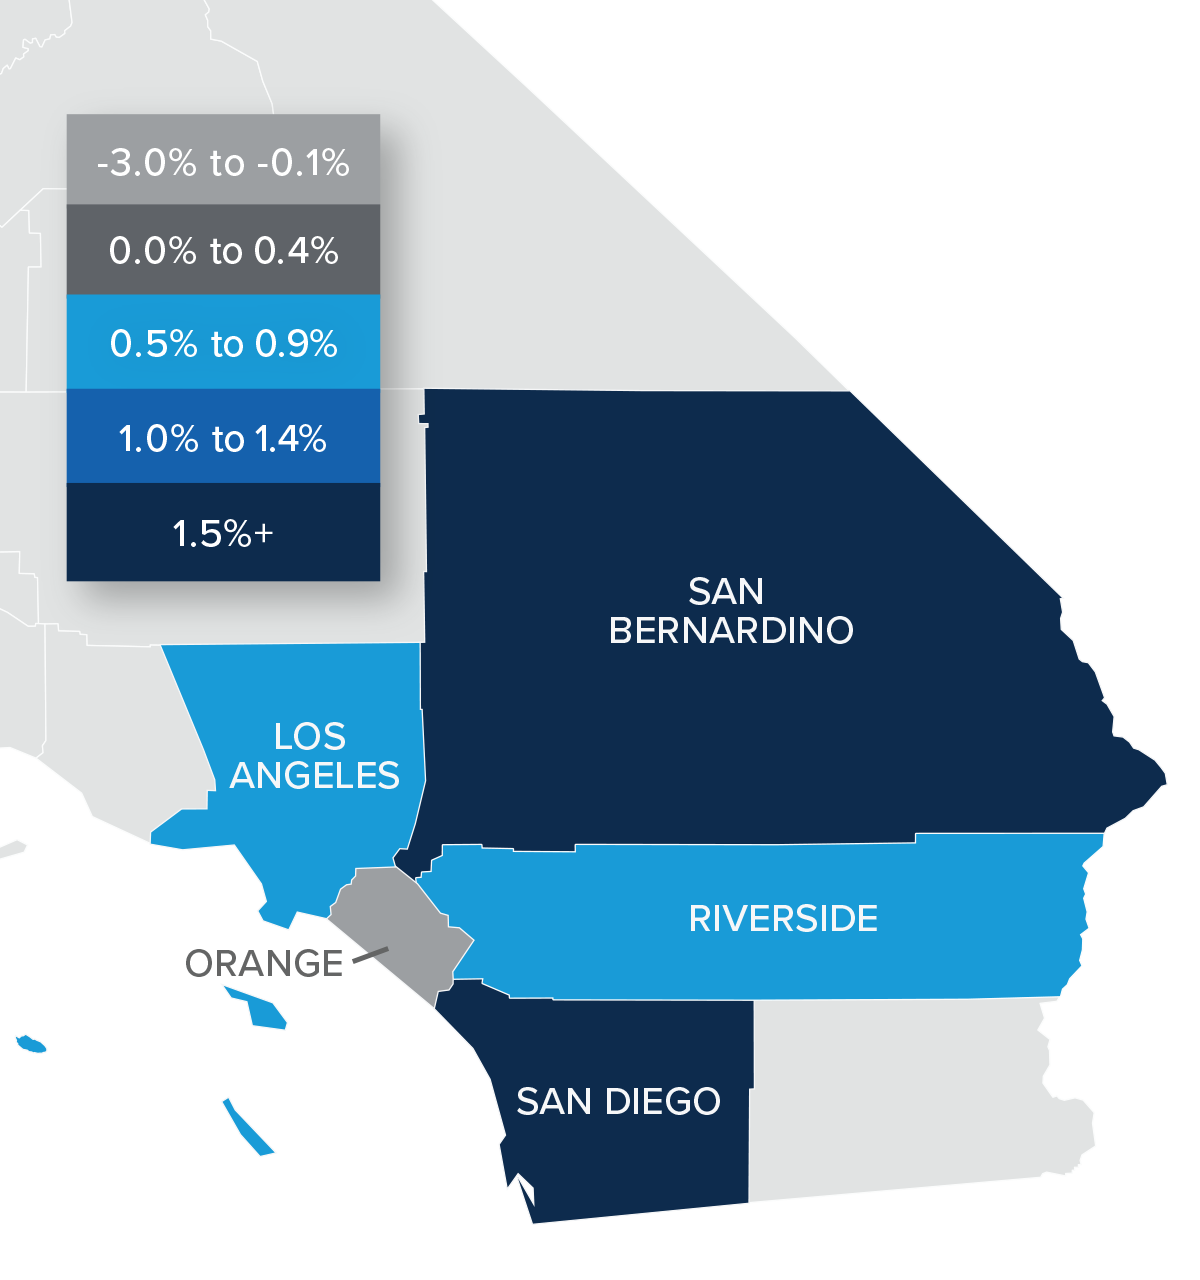
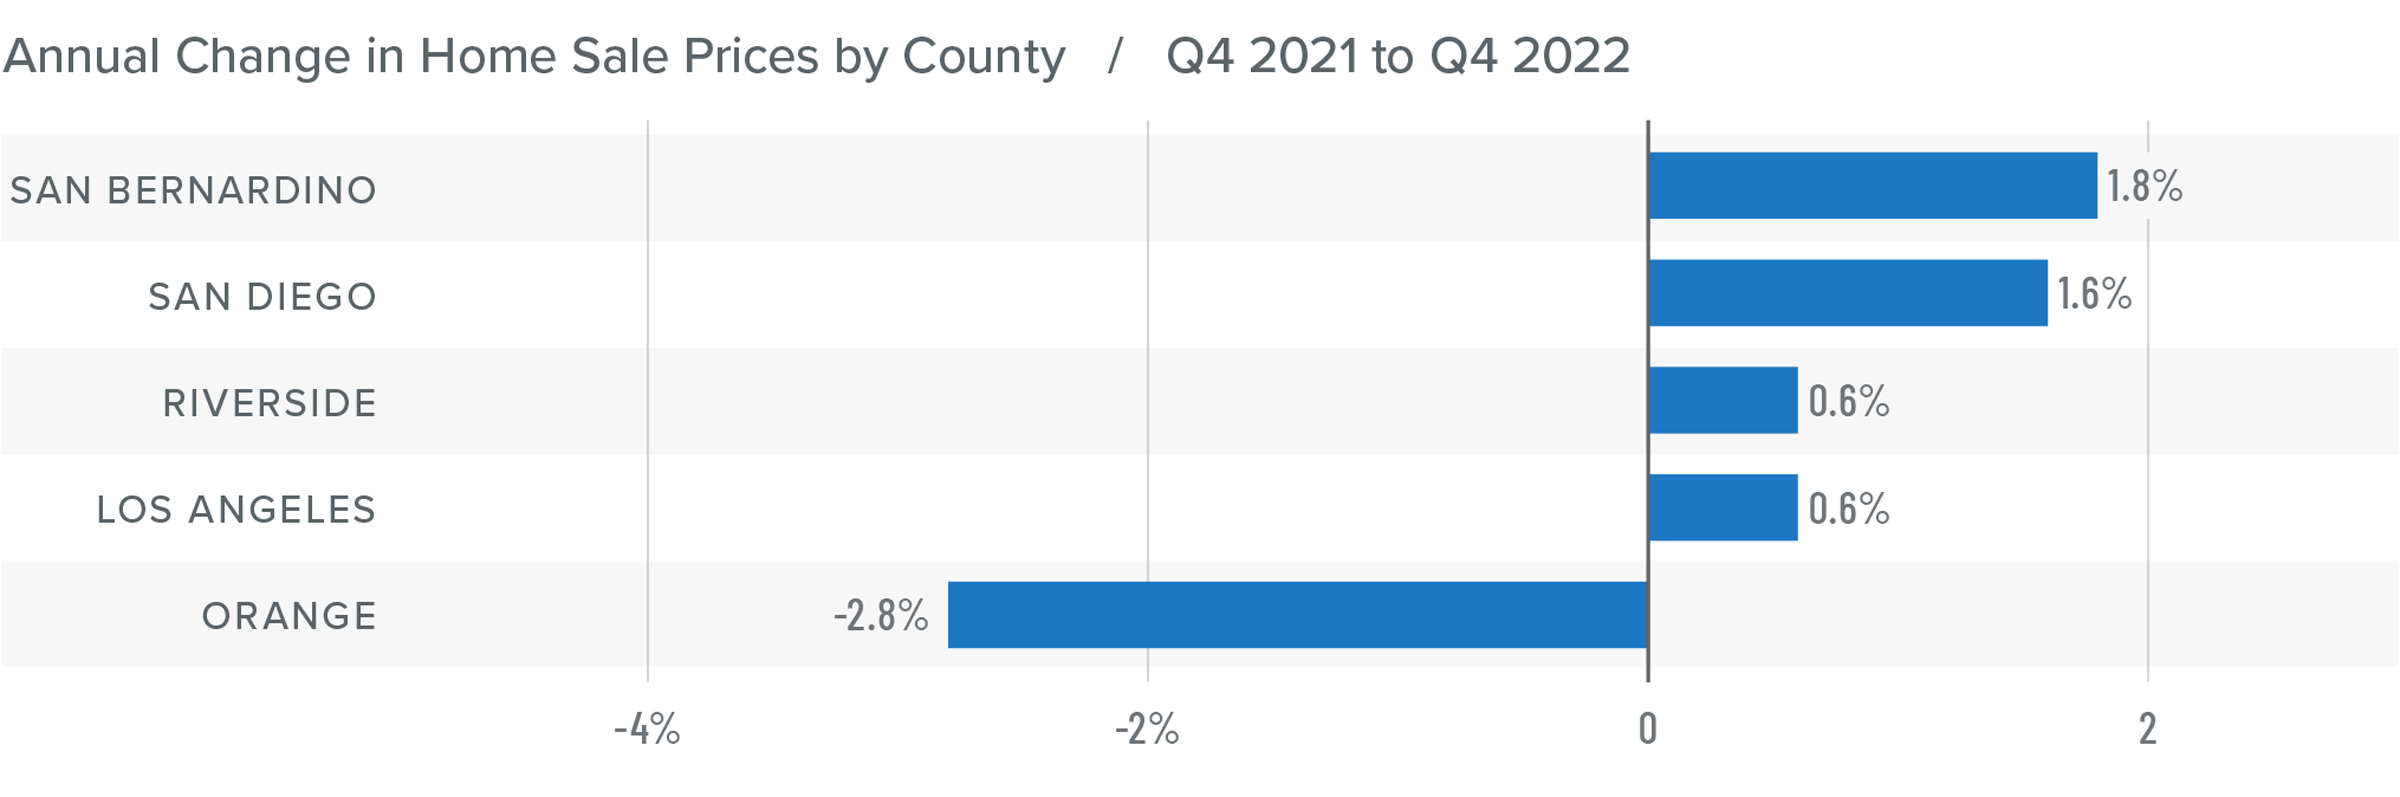
❱ Fourth quarter home sale prices were .7% higher than the same period the prior year but were 2.5% lower than in the third quarter of 2022.
❱ Mortgage rates, which peaked in October, have impacted both the number of sales and prices. Median listing prices were down 4.9%, which indicates that sellers have been adjusting their expectations, but I believe they will fall further before stability in the market is restored.
❱ The region had very modest price growth in all markets other than Orange County, where prices fell 2.8%. Compared to the third quarter of 2022, prices were lower across all markets other than Los Angeles County, where they rose .2%.
❱ Mortgage rates have started to pull back. If this continues, I am hopeful that the second half of 2023 will be more active, resulting in rising sales and home prices.
Mortgage Rates
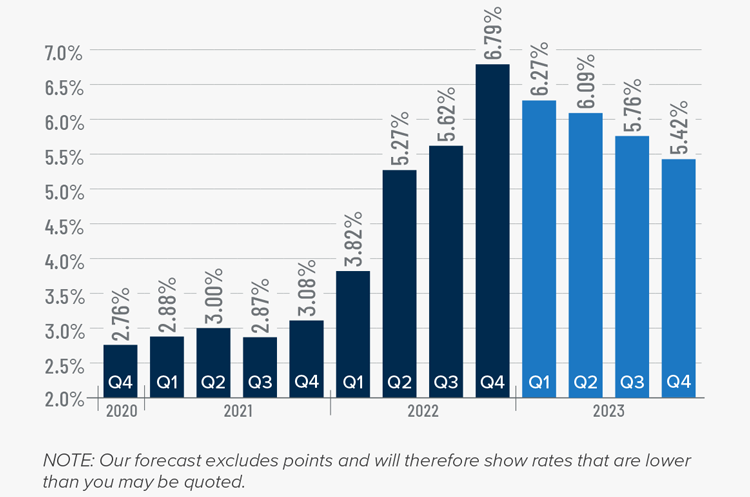
Rates rose dramatically in 2022, but I believe that they have now peaked. Mortgage rates are primarily based on the prices and yields of bonds, and while bonds take cues from several places, they are always impacted by inflation and the economy at large. If inflation continues to fall, as I expect it will, rates will continue to drop.
My current forecast is that mortgage rates will trend lower as we move through the year. While this may be good news for home buyers, rates will still be higher than they have become accustomed to. Even as the cost of borrowing falls, home prices in expensive markets will probably fall a bit more to compensate for rates that will likely hold above 6% until early summer.
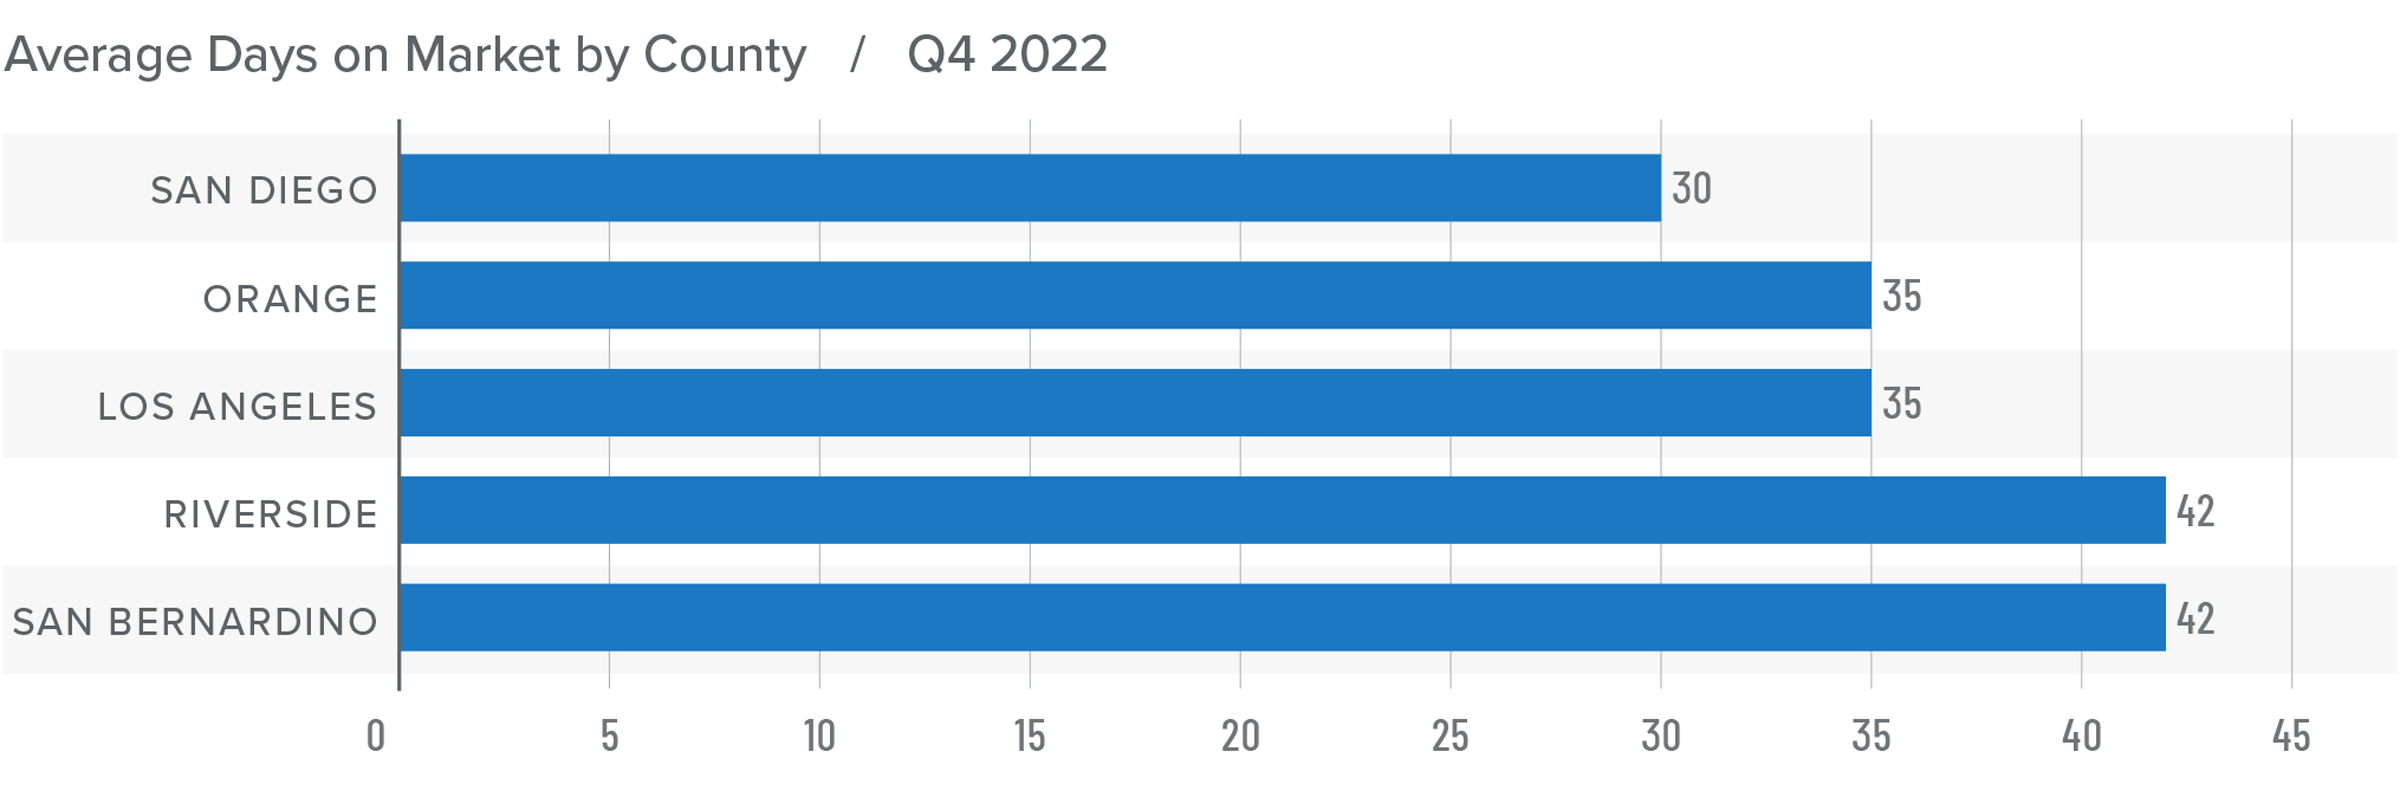
Southern California Days on Market
❱ In the final quarter of 2022, the average time it took to sell a home in the region was 37 days, which was 15 more than the same period the year prior and 11 more than in the third quarter of 2022.
❱ Compared to the third quarter of 2022, market time rose in all counties covered by this report.
❱ Homes in San Diego County continue to sell at a faster rate than other markets in the region, but market time increased in all counties year over year.
❱ More choice and higher mortgage rates appear to be sidelining some buyers. Whether they resume their search for a home in the spring may depend on the direction of mortgage rates and whether prices start to stabilize.
Conclusions
This speedometer reflects the state of the region’s real estate market using housing inventory, price gains, home sales, interest rates, and larger economic factors.
Job growth has slowed, which may be at least partly attributable to businesses expecting to see the economy slow as we move through this year. The housing market is very susceptible to economic turbulence. This, combined with higher financing costs and softening prices, has caused a lull in the market.

There is no doubt that regional home values are resetting following the frenetic market during the pandemic when mortgage rates were artificially low. I expect prices to move modestly lower this spring before stabilizing and starting to rise again in the second half of the year. All things considered, I have moved the needle to a neutral position, favoring neither buyers nor sellers.
About Matthew Gardner

As Chief Economist for Windermere Real Estate, Matthew Gardner is responsible for analyzing and interpreting economic data and its impact on the real estate market on both a local and national level. Matthew has over 30 years of professional experience both in the U.S. and U.K.
In addition to his day-to-day responsibilities, Matthew sits on the Washington State Governors Council of Economic Advisors; chairs the Board of Trustees at the Washington Center for Real Estate Research at the University of Washington; and is an Advisory Board Member at the Runstad Center for Real Estate Studies at the University of Washington where he also lectures in real estate economics.