
The following analysis of select counties of the Southern California real estate market is provided by Windermere Real Estate Chief Economist Matthew Gardner. We hope that this information may assist you with making better-informed real estate decisions. For further information about the housing market in your area, please don’t hesitate to contact your Windermere Real Estate agent.
Regional Economic Overview
The employment market grew by 465,000 jobs over the past 12 months. However, the pace of job creation has been slowing and more recently the region has seen total employment levels drop. I am not overly concerned by this, as state data at the county level is not adjusted for seasonality, and I anticipate more jobs will be added as we move through the fall. Total employment in the counties covered by this report is now only 340,000 short of the pre-pandemic peak, having recovered 96.7% of the jobs that were lost. Los Angeles County still has the largest shortfall (-335,700), followed by Orange County (-41,500) and San Diego County (-15,400). Riverside and San Bernardino counties remain well above pre-pandemic employment levels. The region’s unemployment rate in August was 4.2%, down from 7.8% a year ago. The lowest rates were in Orange County (3%) and San Diego County (3.4%).
Southern California Home Sales
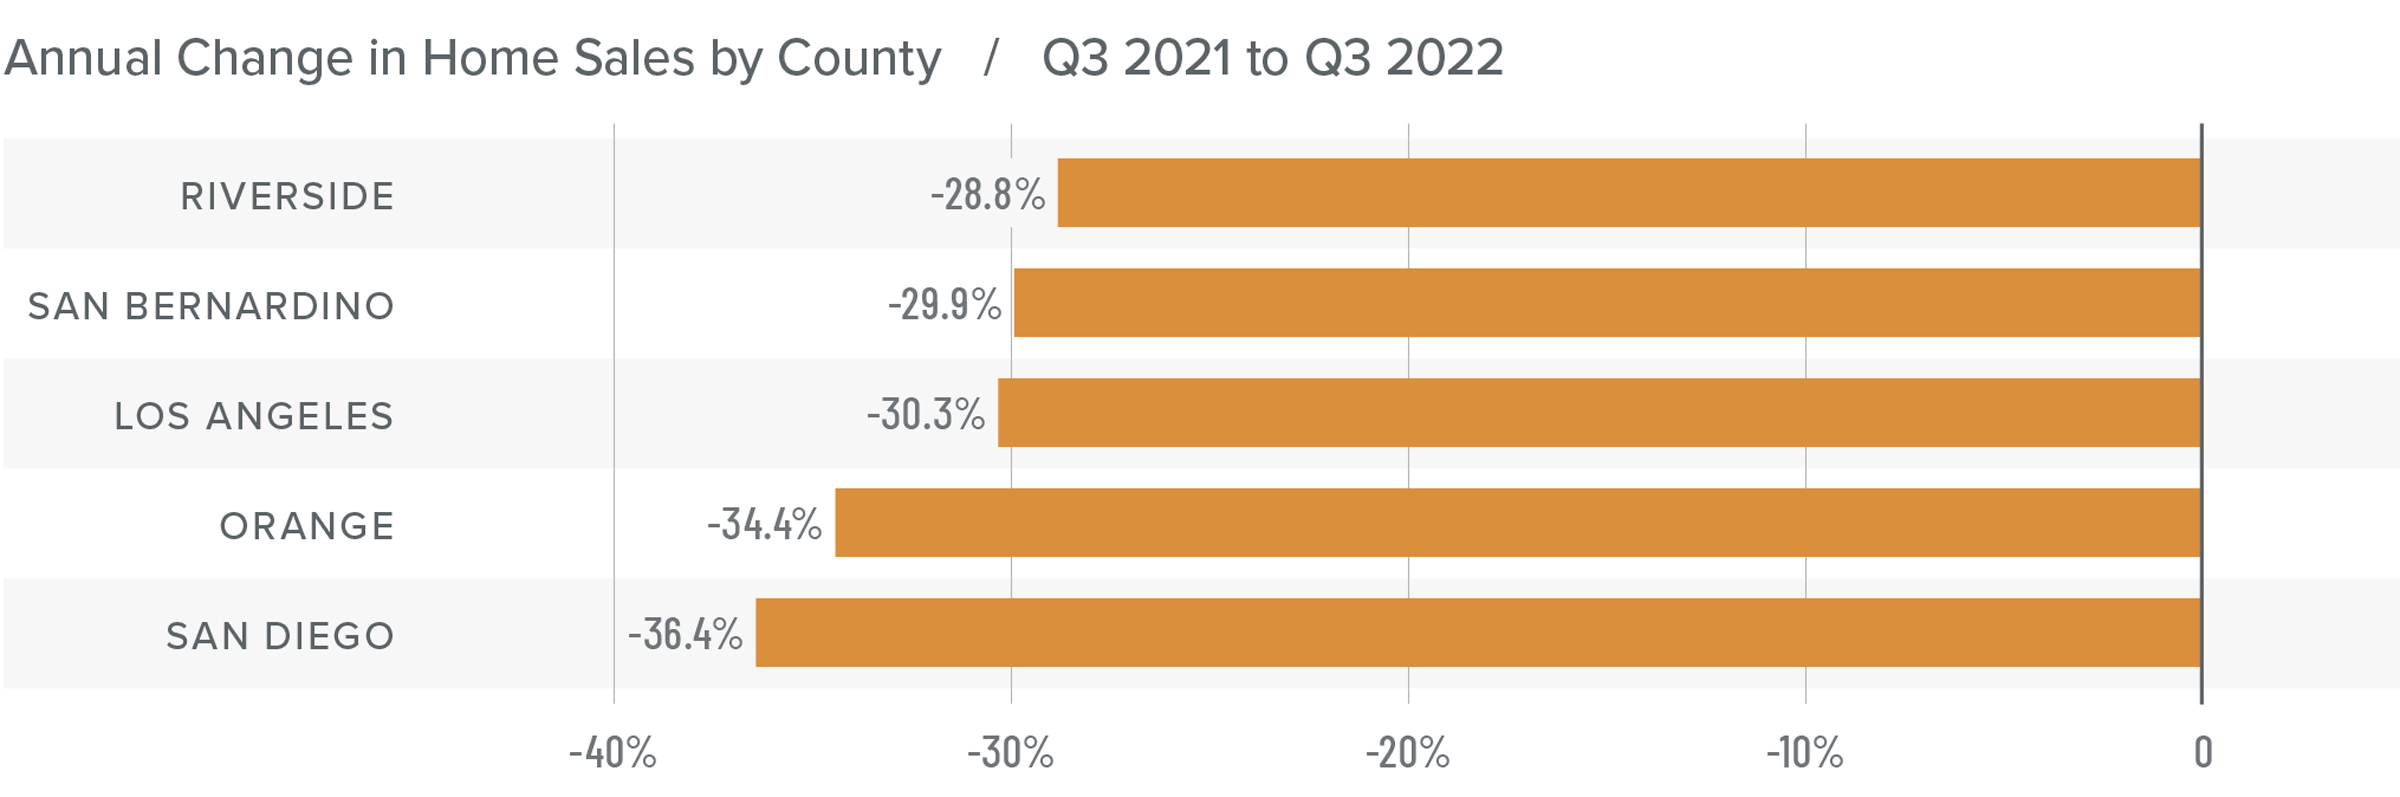
❱ In the third quarter, 38,356 homes sold, which is down 31.8% from a year ago and 19.4% less than the second quarter of the year.
❱ Pending home sales, which are an indicator of future closings, were down 16.2% from the second quarter, suggesting that closed sales in the final quarter of this year may disappoint.
❱ Sales fell the most in San Diego County, but all markets saw significant declines. Relative to the second quarter, transactions were lower across the board, with Riverside County experiencing the greatest decline (-24.1%).
❱ Listing activity rose an average of 41.6% compared to the second quarter. With more choice in the market and median list prices down 6.8% from the second quarter, it seems that many would-be buyers are sitting on the fence to see if prices will fall further.
Southern California Home Prices
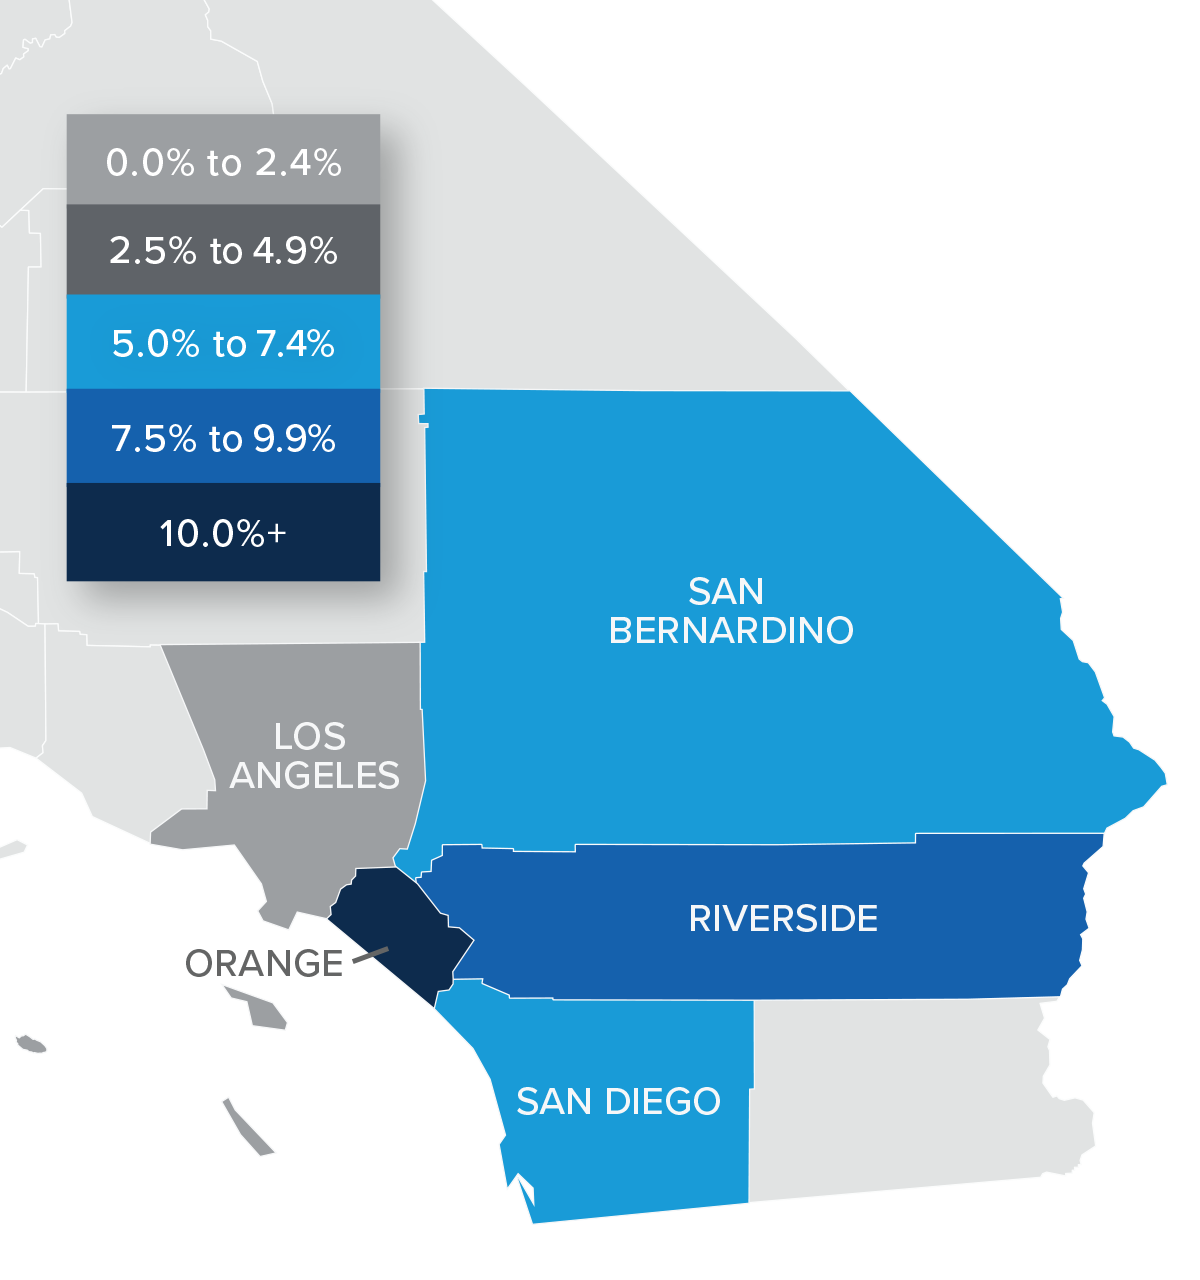
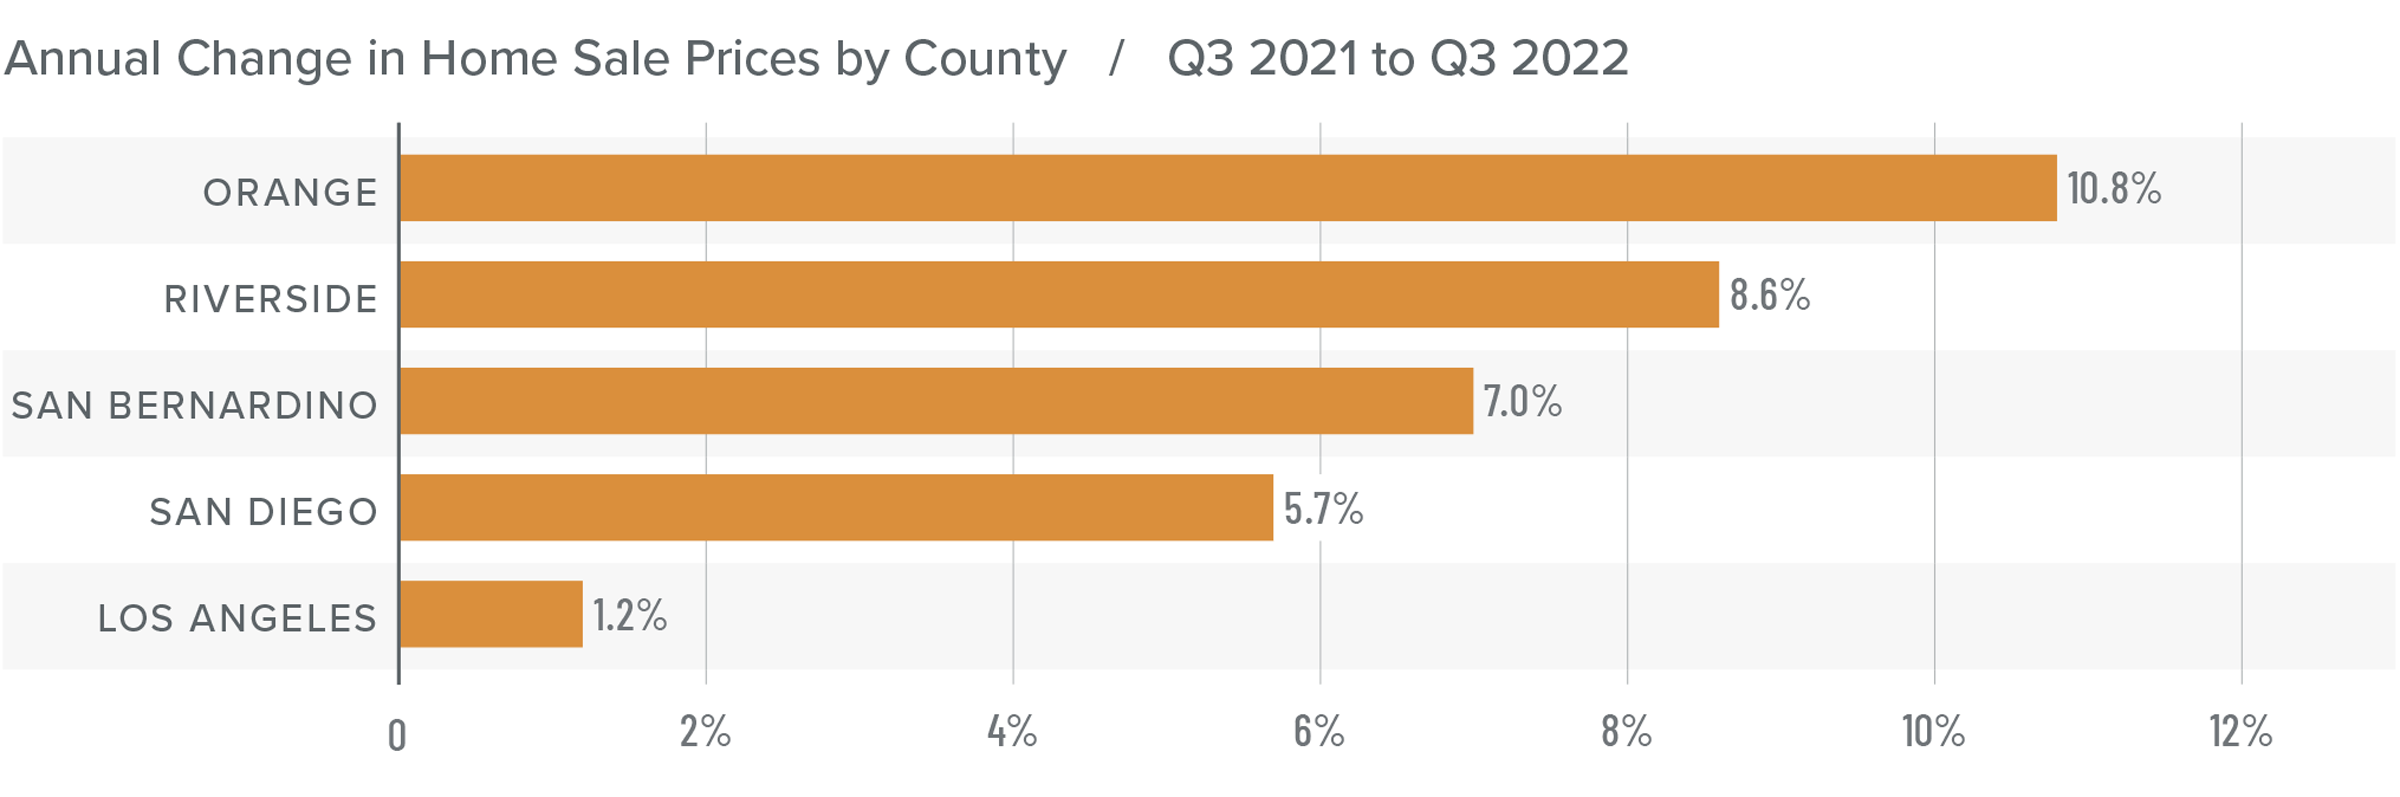
❱ Home sale prices in the quarter rose 4.6% from a year ago but were 7.1% lower than in the second quarter of this year.
❱ Rising mortgage rates are clearly starting to impact the market. This, combined with higher inventory levels, will lead sale prices to continue pulling back.
❱ The region saw double-digit price growth in Orange County, but the overall trend has shown price growth starting to slow. In fact, prices in Los Angeles County rose by only 1.2% year over year.
❱ A period of reversion was inevitable, especially because artificially low mortgage rates could not continue forever. It’s worth remembering that owners saw home values skyrocket over the past few years. This adjustment to home values will only be temporary, and owners still have ample equity in their homes.
Mortgage Rates
This remains an uncertain period for mortgage rates. When the Federal Reserve slowed bond purchases in 2013, investors were accused of having a “taper tantrum,” and we are seeing a similar reaction today. The Fed appears to be content to watch the housing market go through a period of pain as they throw all their tools at reducing inflation.
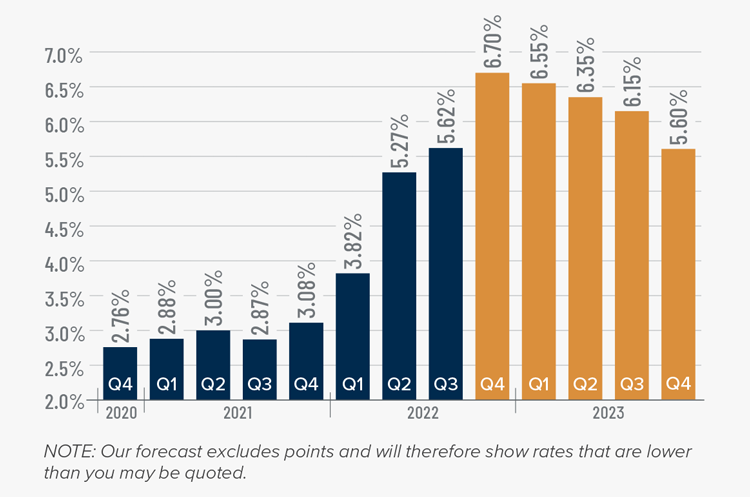
As a result, mortgage rates are out of sync with treasury yields, which not only continues to push rates much higher, but also creates violent swings in both directions. My current forecast calls for rates to peak in the fourth quarter of this year before starting to slowly pull back. That said, they will remain in the 6% range until the end of 2023.
Southern California Days on Market
❱ In the third quarter of 2022, the average time it took to sell a home in the region was 25 days, which is 7 more than a year ago and 9 more days than in the second quarter.
❱ Compared to the second quarter of 2022, market time rose in all counties covered by this report.
❱ Homes in San Diego County continue to sell at a faster rate than other markets in the region. All counties saw market time increase year over year.
❱ More homes for sale and higher financing costs have led to increased days on market. That said, it’s important to put the data into perspective; in the third quarter of 2019, the average market time in the region was 42 days.

Conclusions
This speedometer reflects the state of the region’s real estate market using housing inventory, price gains, home sales, interest rates, and larger economic factors.
The housing market has entered a period of transition following the overheated conditions in 2020-2021. Though the headline numbers are far from buoyant, it’s important to understand that the region is only reverting back to where it was before the pandemic. Any belief that the area is going to experience the same meltdown as it went through in the late 2000s is simply inaccurate. There will be an uncomfortable period, but a return to fundamentals is necessary.

As such, I have moved the needle more in favor of buyers as the region continues to trend back toward balance.
About Matthew Gardner

As Chief Economist for Windermere Real Estate, Matthew Gardner is responsible for analyzing and interpreting economic data and its impact on the real estate market on both a local and national level. Matthew has over 30 years of professional experience both in the U.S. and U.K.
In addition to his day-to-day responsibilities, Matthew sits on the Washington State Governors Council of Economic Advisors; chairs the Board of Trustees at the Washington Center for Real Estate Research at the University of Washington; and is an Advisory Board Member at the Runstad Center for Real Estate Studies at the University of Washington where he also lectures in real estate economics.