
Q2 2023 Southern California Real Estate Market Update
The following analysis of select counties of the Southern California real estate market is provided by Windermere Real Estate Chief Economist Matthew Gardner. We hope that this information may assist you with making better-informed real estate decisions. For further information about the housing market in your area, please don’t hesitate to contact your Windermere Real Estate agent.
Regional Economic Overview
The Southern California market areas contained in this report added 222,700 jobs over the past 12 months, representing a decent growth rate of 2.4%. Although layoffs in the tech sector and the writers’ strike have been dominating headlines, payrolls in Southern California continue to expand. The Los Angeles market has added over 60,000 jobs through the first five months of this year. This was followed by Orange County, which added 19,000 jobs. San Diego County added 16,600 jobs, and employment grew by 6,700 jobs in Riverside County. The region has seen the pace of employment growth slow, but this appears to be more an issue of labor supply rather than a lack of demand. The region’s unemployment rate in May was 4.3%, up from 3.7% in the same quarter of 2022. The lowest jobless rates were in Orange County (3.2%) and San Diego County (3.5%). The highest rate was in Los Angeles County, where 4.8% of the workforce was without a job.
Southern California Home Sales
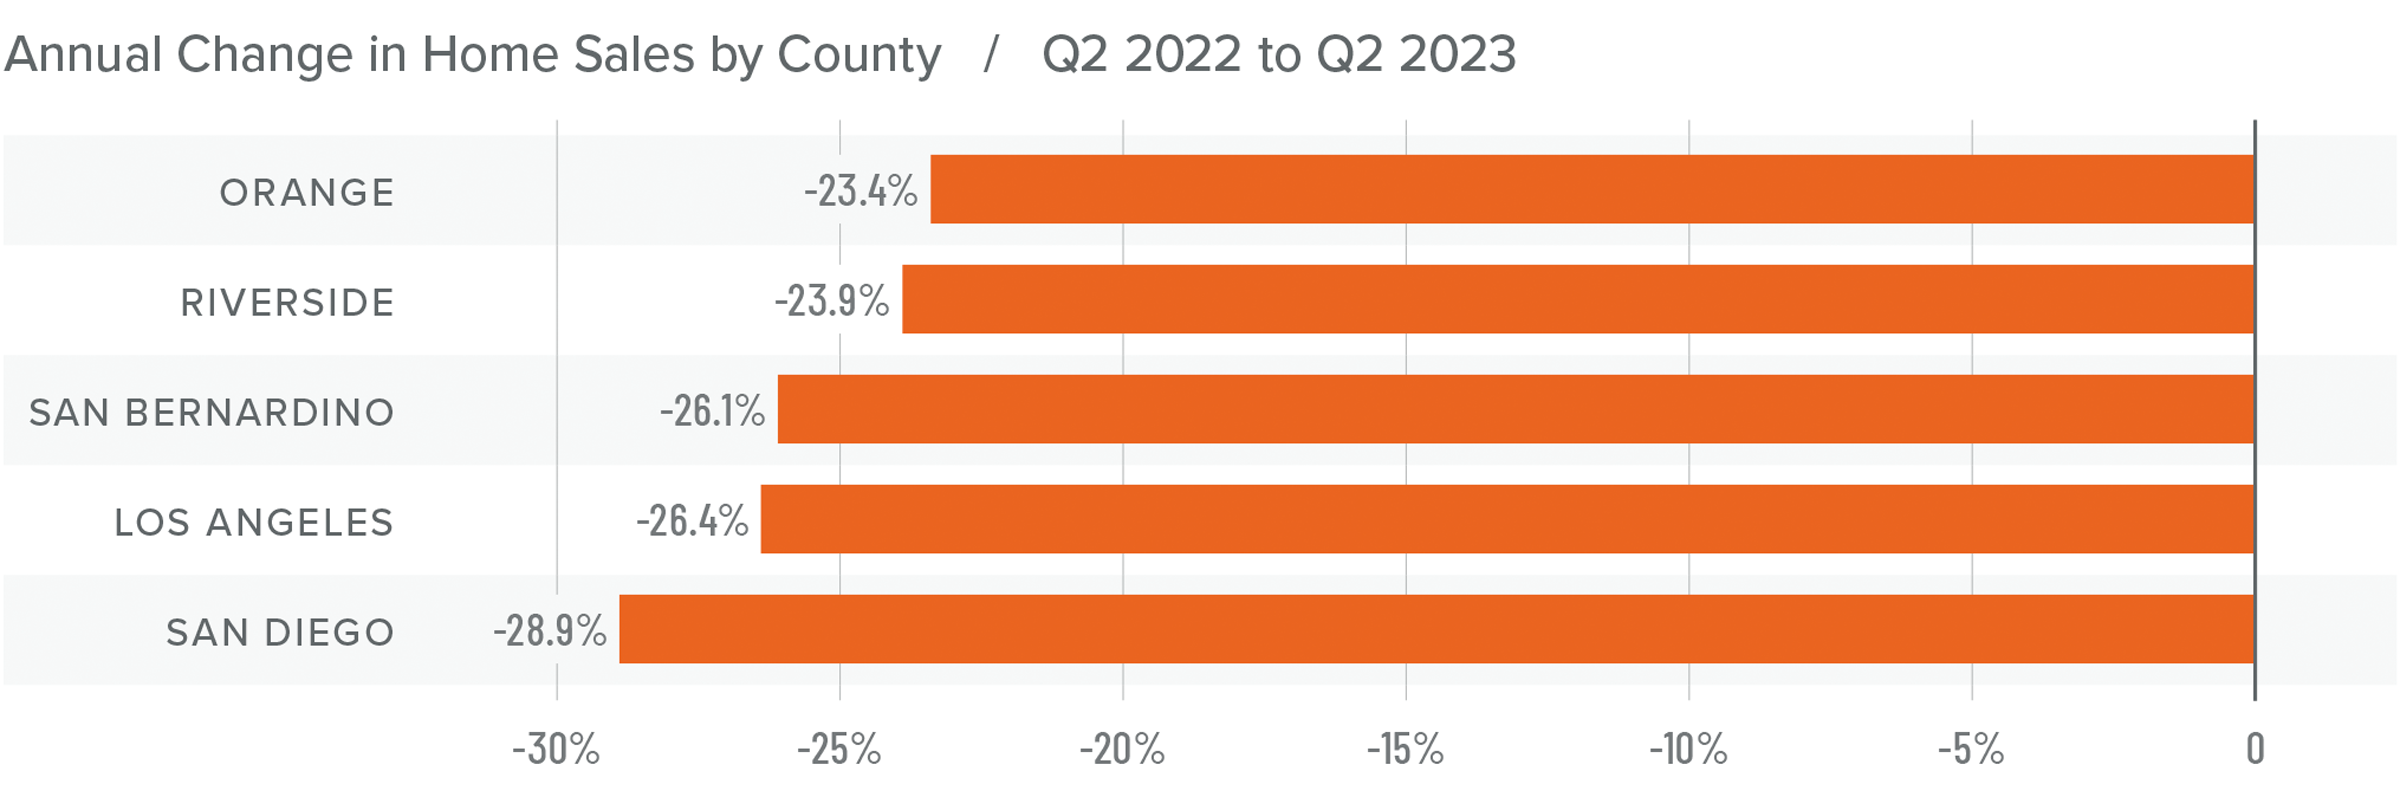
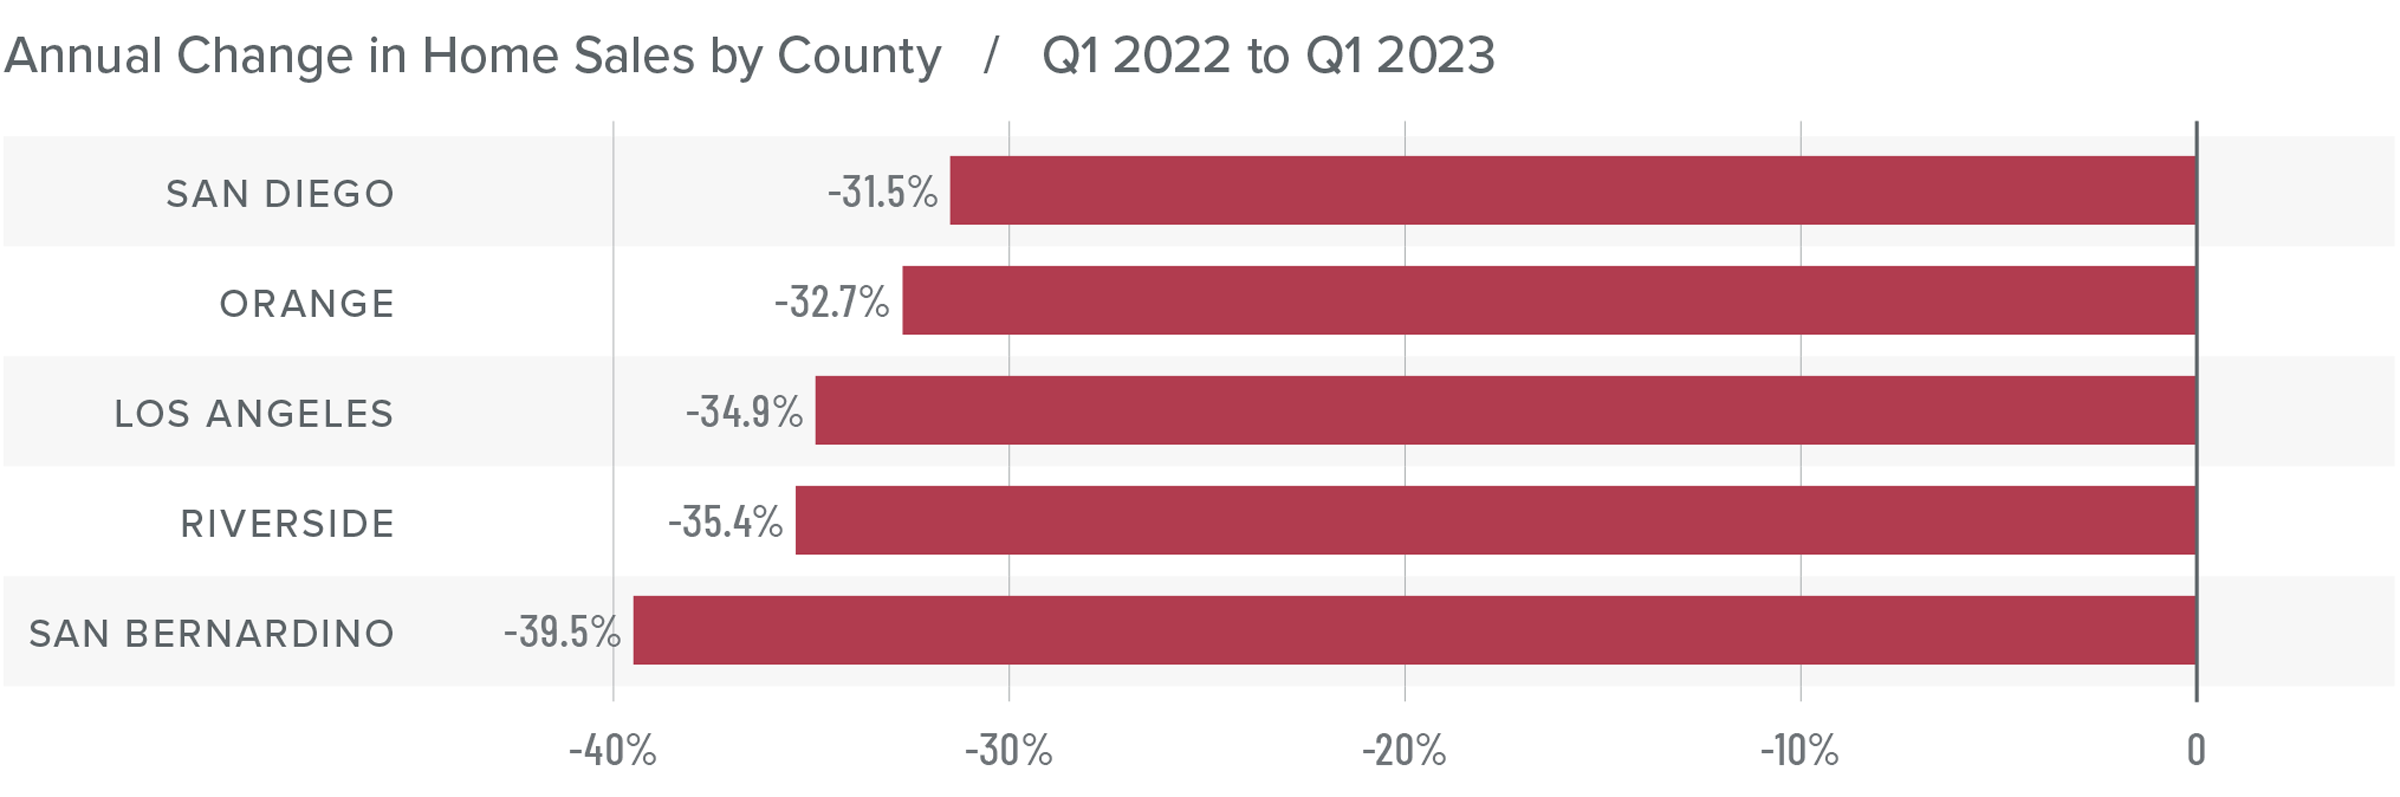
❱ In the second quarter of 2023, 35,381 homes sold, which was 25.9% lower than in the second quarter of 2022 but up an impressive 27.7% compared to the first quarter of 2023.
❱ Pending home sales, an indicator of future closings, were 13.9% higher than in the first quarter, suggesting that sales activity has room to rise further as we move into the second half of the year.
❱ Compared to the same quarter in 2022, sales fell across the board. However, the market heated up in the second quarter compared to the first quarter of 2023: sales were up 36% in Orange County, 29.6% in Los Angeles County, 28.4% in San Bernardino County, 24.3% in Riverside County, and 20.5% in San Diego County.
❱ The growth in sales was even more impressive given significantly rising financing costs in the second quarter.
Southern California Home Prices
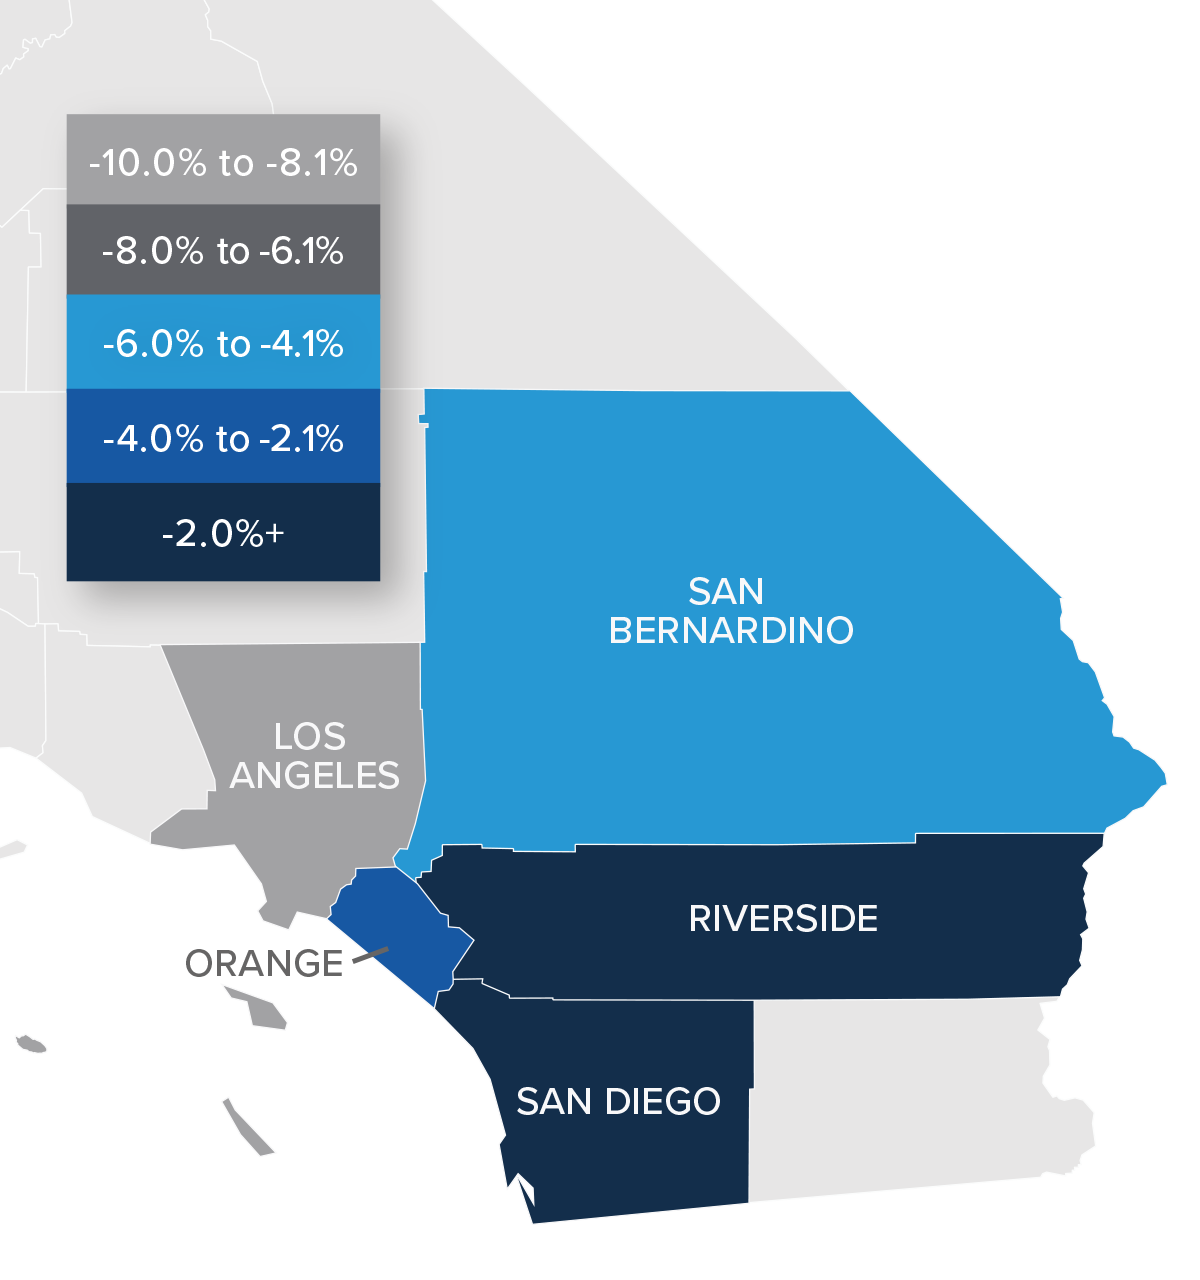
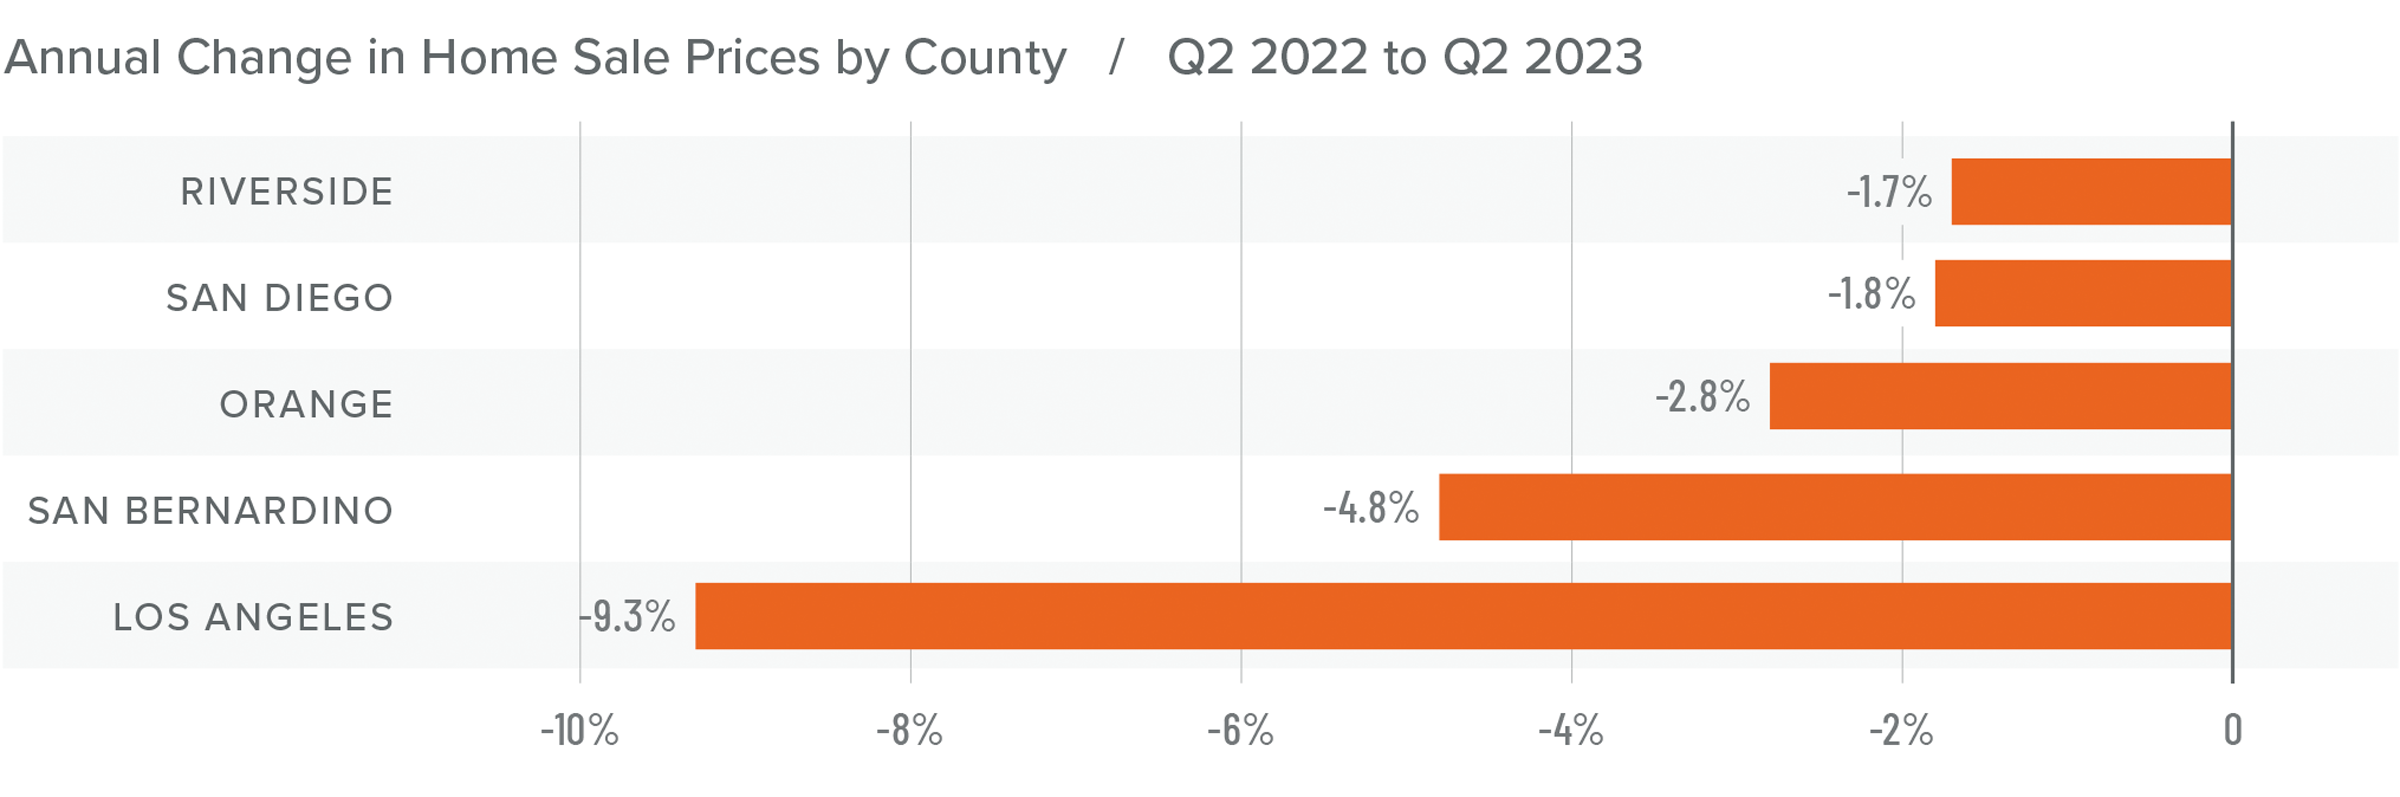
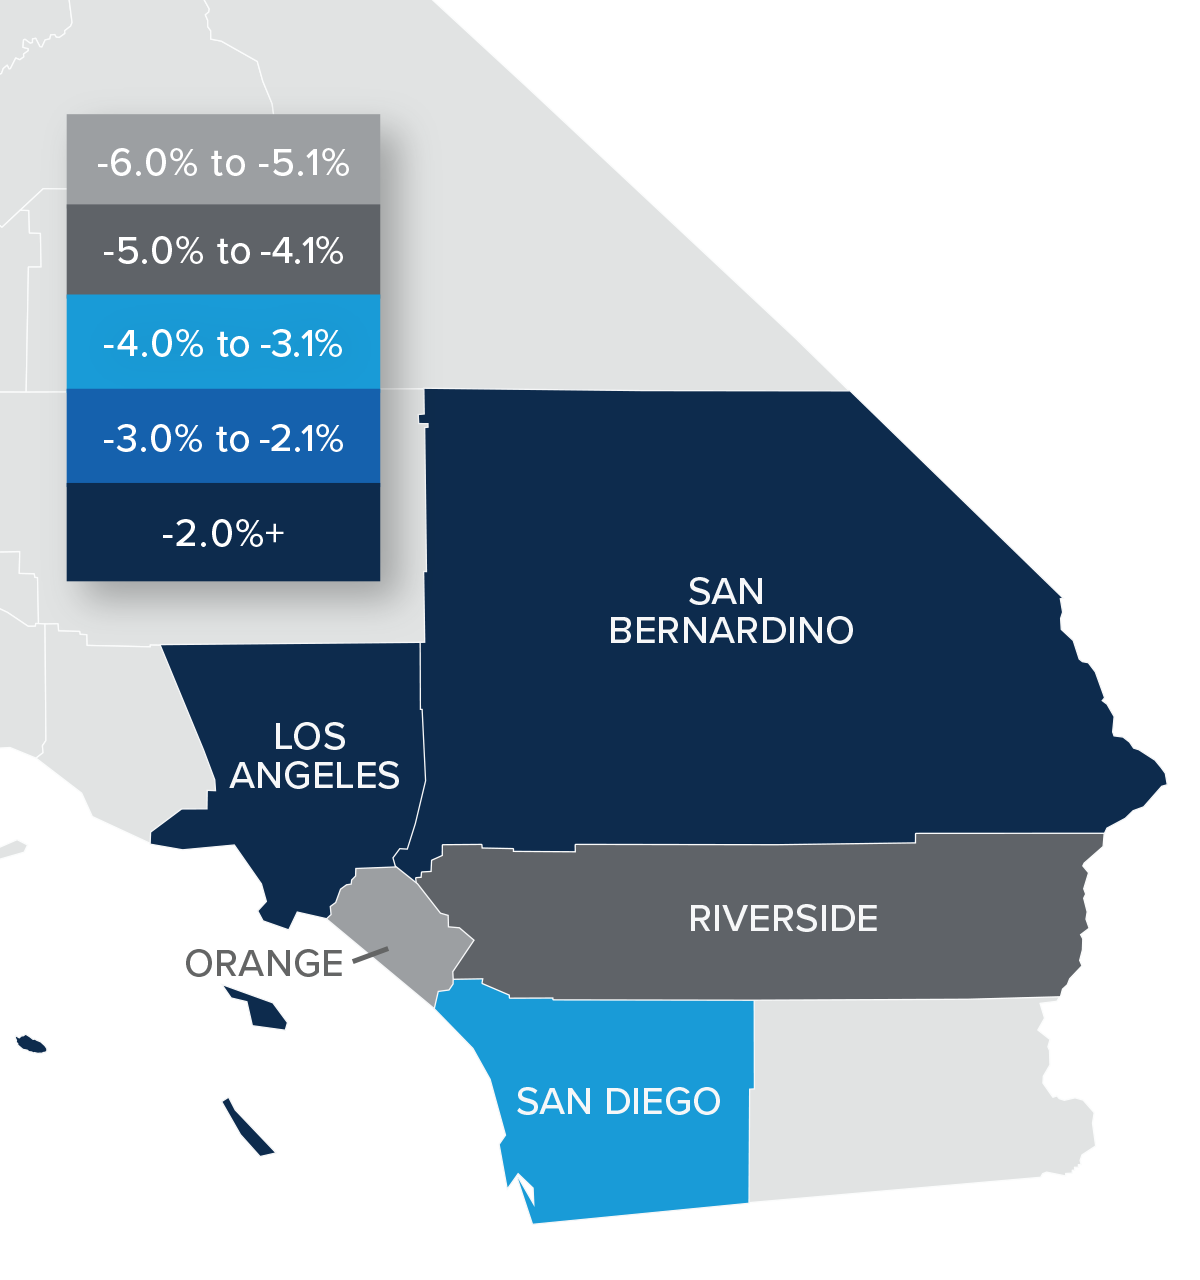
❱ Compared to the second quarter of 2022, home sale prices were 5.5% lower. However, they were 2.1% higher than in the first quarter of 2023.
❱ Affordability continues to be a significant constraint in the region. With median list prices rising 21% in San Diego County and 20% in Los Angeles County compared to the first quarter, it appears that sellers’ confidence levels continue to rise, which will further impact housing affordability.
❱ Year over year, prices pulled back across the region, with a significant drop in Los Angeles County. Compared to the first quarter of 2023, Los Angeles prices fell 4.1%. Closed sale prices rose in the rest of the market areas.
❱ The region has demonstrated significantly more resilience to higher financing costs than expected. As we move through the balance of 2023, I expect prices to rise further, but at a very modest pace.
Mortgage Rates
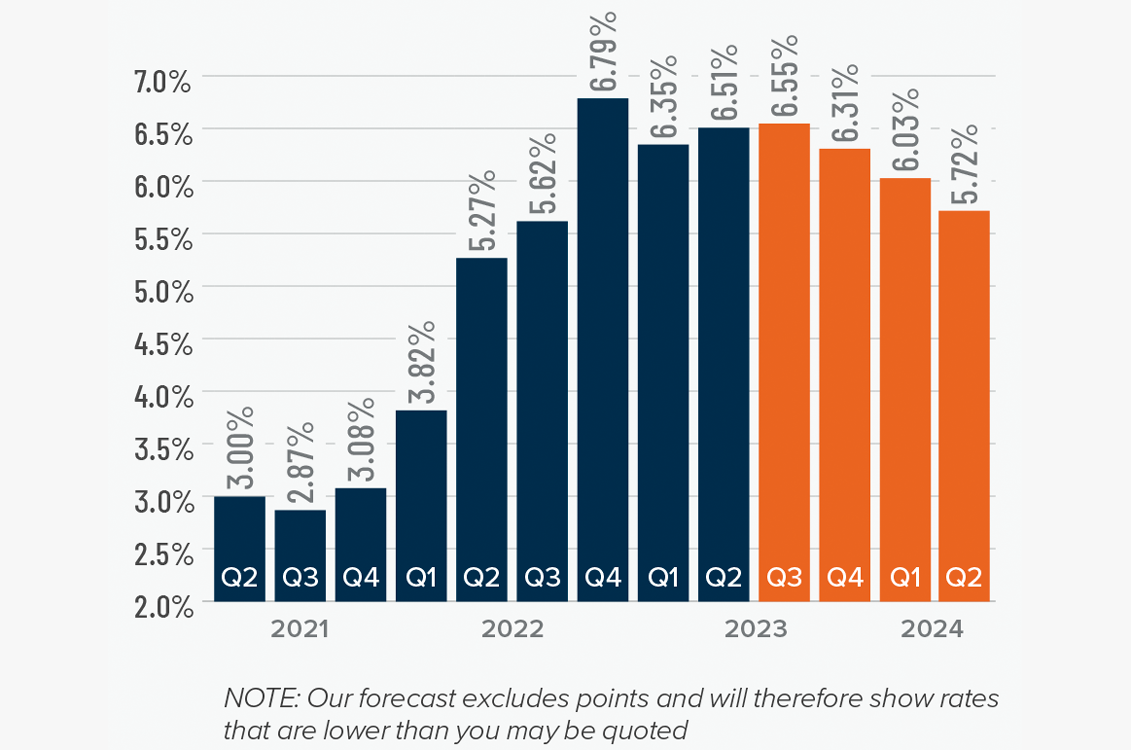
Although they were less erratic than the first quarter, mortgage rates unfortunately trended higher and ended the quarter above 7%. This was due to the short debt ceiling impasse, as well as several economic datasets that suggested the U.S. economy was not slowing at the speed required by the Federal Reserve.
While the June employment report showed fewer jobs created than earlier in the year, as well as downward revisions to prior gains, inflation has not sufficiently slowed. Until it does, rates cannot start to trend consistently lower. With the economy not slowing as fast as expected, I have adjusted my forecast: Rates will hold at current levels in third quarter and then start to trend lower through the fall. Although there are sure to be occasional spikes, my model now shows the 30-year fixed rate breaking below 6% next spring.
Southern California Days on Market
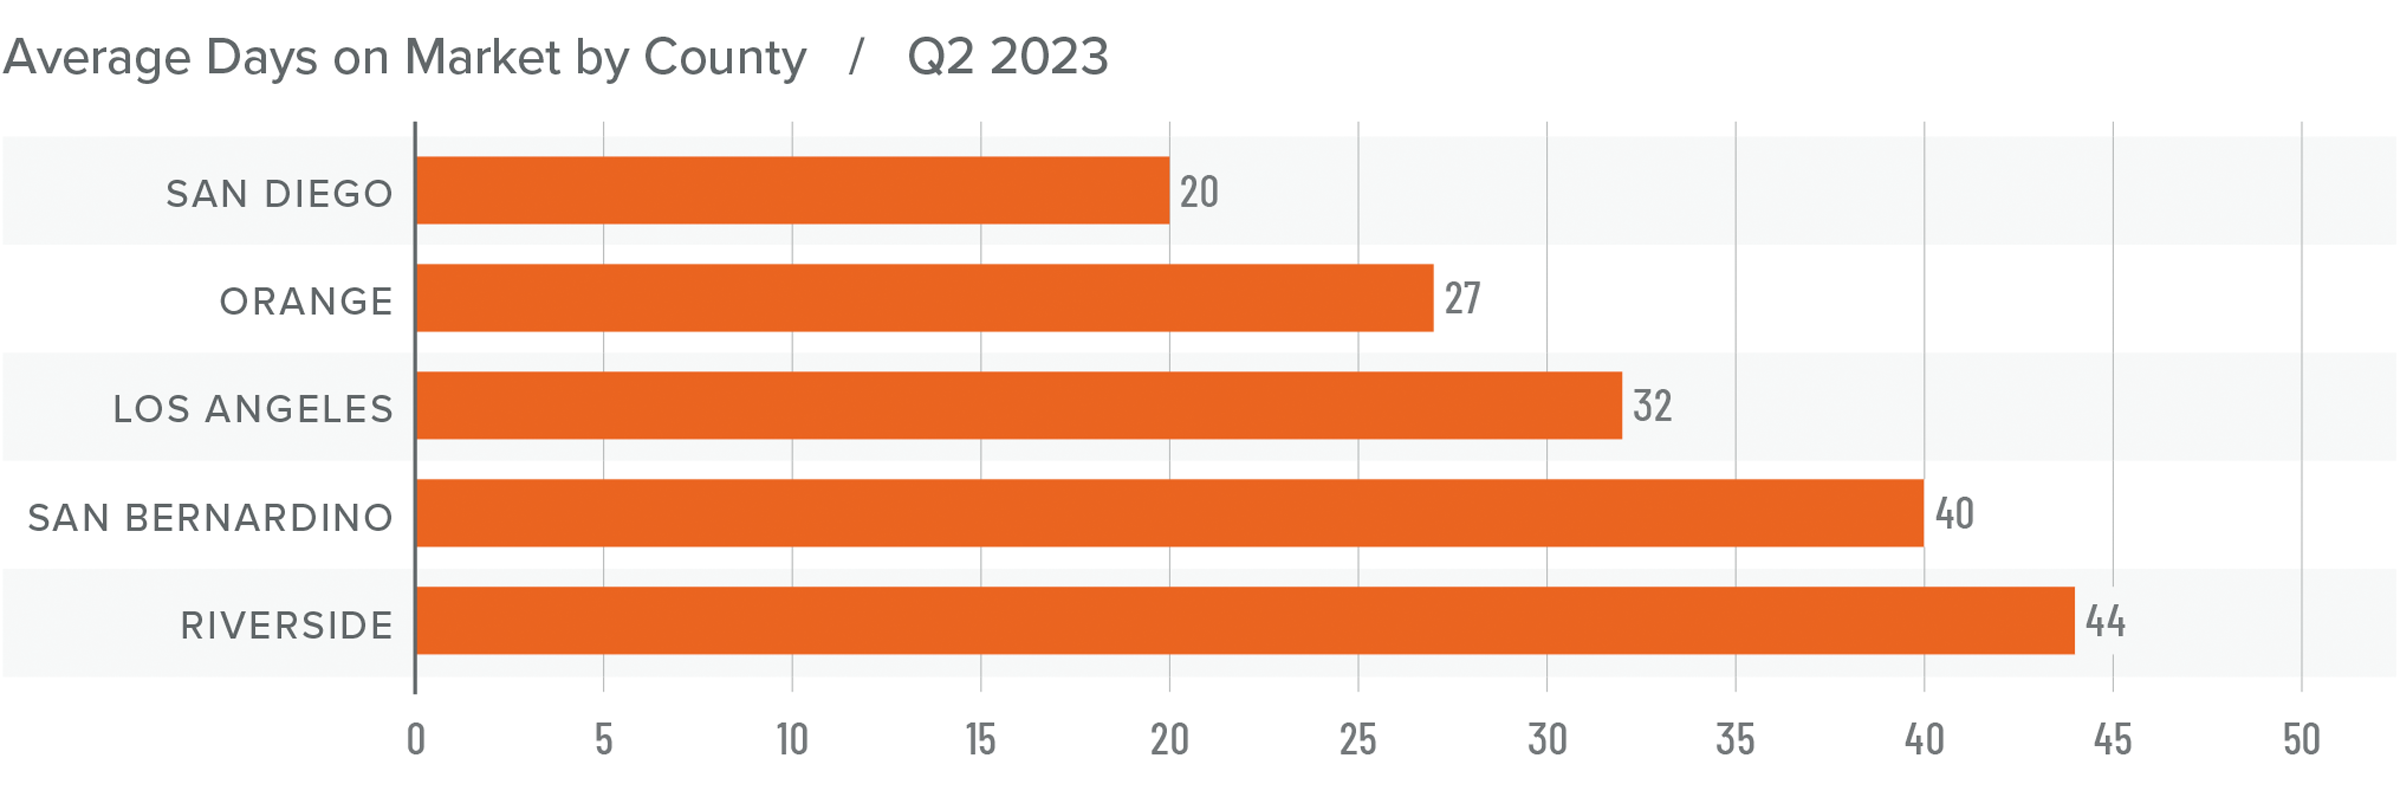
❱ In the second quarter of 2023, the average time it took to sell a home in the region was 32 days, which was 16 more than in the second quarter of 2022 but 13 fewer days than in the first quarter of 2023.
❱ Compared to the first quarter of 2023, market time fell in all counties covered by this report.
❱ Homes in San Diego County continue to sell at a faster rate than other markets in the region, but all counties saw market time increase from a year ago.
❱ Home buyers appear to be resigned to the fact that supply levels are unlikely to improve any time soon and believe that prices are not going to fall further. This is leading them to pursue buying a home even if mortgage rates remain very high, with the hope they will be able to refinance when rates eventually fall.
Conclusions
This speedometer reflects the state of the region’s real estate market using housing inventory, price gains, home sales, interest rates, and larger economic factors.
Home prices have stabilized and are starting to trend higher again. This is counterintuitive, especially given that mortgage rates are higher than the market has seen in over 15 years. However, the reason for this is straightforward: a lack of supply is bolstering home values. It will only be when supply levels rise to match demand that we will start to move toward a more balanced market. The issue, though, is that 85.7% of California homeowners with a mortgage have an average interest rate below 5%, and 30% have rates at or below 3%. I find it highly unlikely that homeowners will give up their current rate unless they absolutely have to, which is holding back supply.
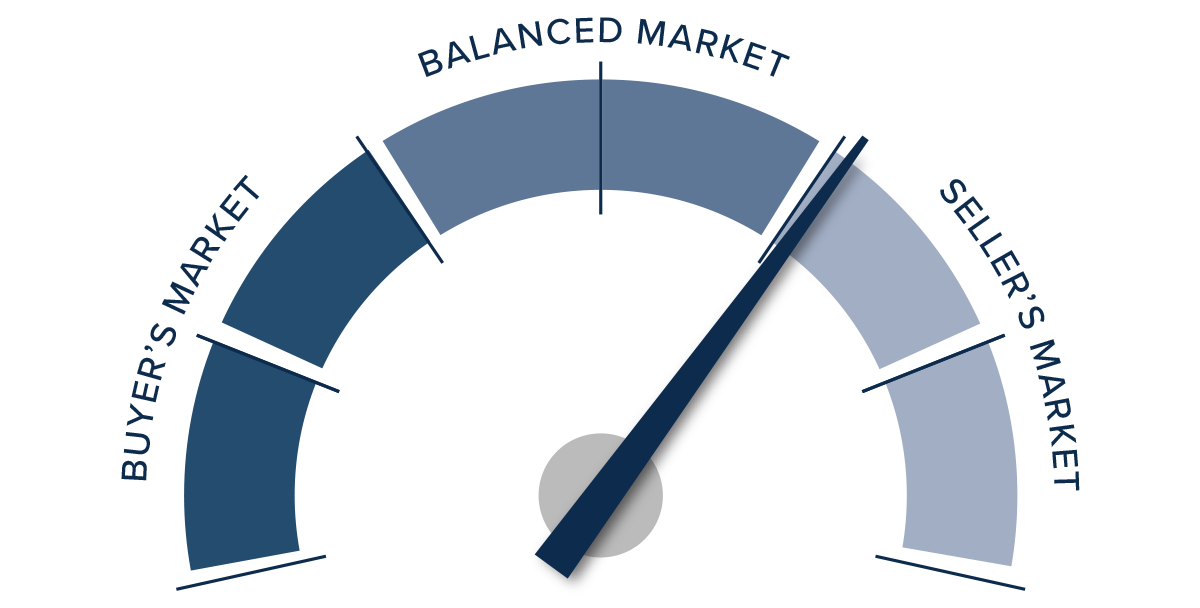
Homeowners who do decide to sell are aware of this and are increasingly confident in their ability to sell their homes regardless of mortgage rates. Given these factors, I have moved the needle into the seller’s sector of the speedometer.
About Matthew Gardner

As Chief Economist for Windermere Real Estate, Matthew Gardner is responsible for analyzing and interpreting economic data and its impact on the real estate market on both a local and national level. Matthew has over 30 years of professional experience both in the U.S. and U.K.
In addition to his day-to-day responsibilities, Matthew sits on the Washington State Governors Council of Economic Advisors; chairs the Board of Trustees at the Washington Center for Real Estate Research at the University of Washington; and is an Advisory Board Member at the Runstad Center for Real Estate Studies at the University of Washington where he also lectures in real estate economics.

Q1 2023 Southern California Real Estate Market Update
The following analysis of select counties of the Southern California real estate market is provided by Windermere Real Estate Chief Economist Matthew Gardner. We hope that this information may assist you with making better-informed real estate decisions. For further information about the housing market in your area, please don’t hesitate to contact your Windermere Real Estate agent.
Regional Economic Overview
Following annual revisions to the data, the Southern California market added only 194,000 jobs in 2022, which was far fewer than the over 676,000 added in 2021. The first two months of data for 2023 showed a net loss of 14,800 jobs. Because the data is not adjusted for seasonality, I am not overly concerned by this decline, but I will be watching as we move through the spring to see if declining job growth is becoming pervasive. Total employment in the counties covered by this report is still 266,400 jobs shy of the pre-pandemic peak. Los Angeles County continues to have the largest shortfall of jobs (-260,000), followed by Orange County (-37,100). Job levels in San Diego County match their pre-pandemic peak, while employment levels in the Riverside and San Bernardino markets are each higher by more than 15,000 jobs. The region’s unemployment rate in February was 4.6%, down from 5% at the same time in 2022. The lowest jobless rates were in Orange County (3.4%) and San Diego County (3.7%). The highest was in Los Angeles County, where 5.3% of the workforce was without a job.
Southern California Home Sales
❱ In the first quarter of 2023, 27,577 homes sold, which is down 34.8% from the first quarter of 2022 and is 5.2% lower than in the final quarter of 2022.
❱ Pending home sales, which are an indicator of future closings, were 25.4% higher than in the fourth quarter, suggesting that sales activity in the second quarter of this year may pick up.
❱ On a percentage basis, sales fell the most in San Bernardino County, but all markets pulled back significantly. Compared to the fourth quarter, sales were higher in Riverside County (+7.1%) but fell across the balance of the market.
❱ The drop in sales can mainly be attributed to a lack of inventory: the number of homes for sale was down 27.6% from the final quarter of 2022. Additionally, mortgage rates rose by more than a full percentage point in February, which likely also impacted sales.
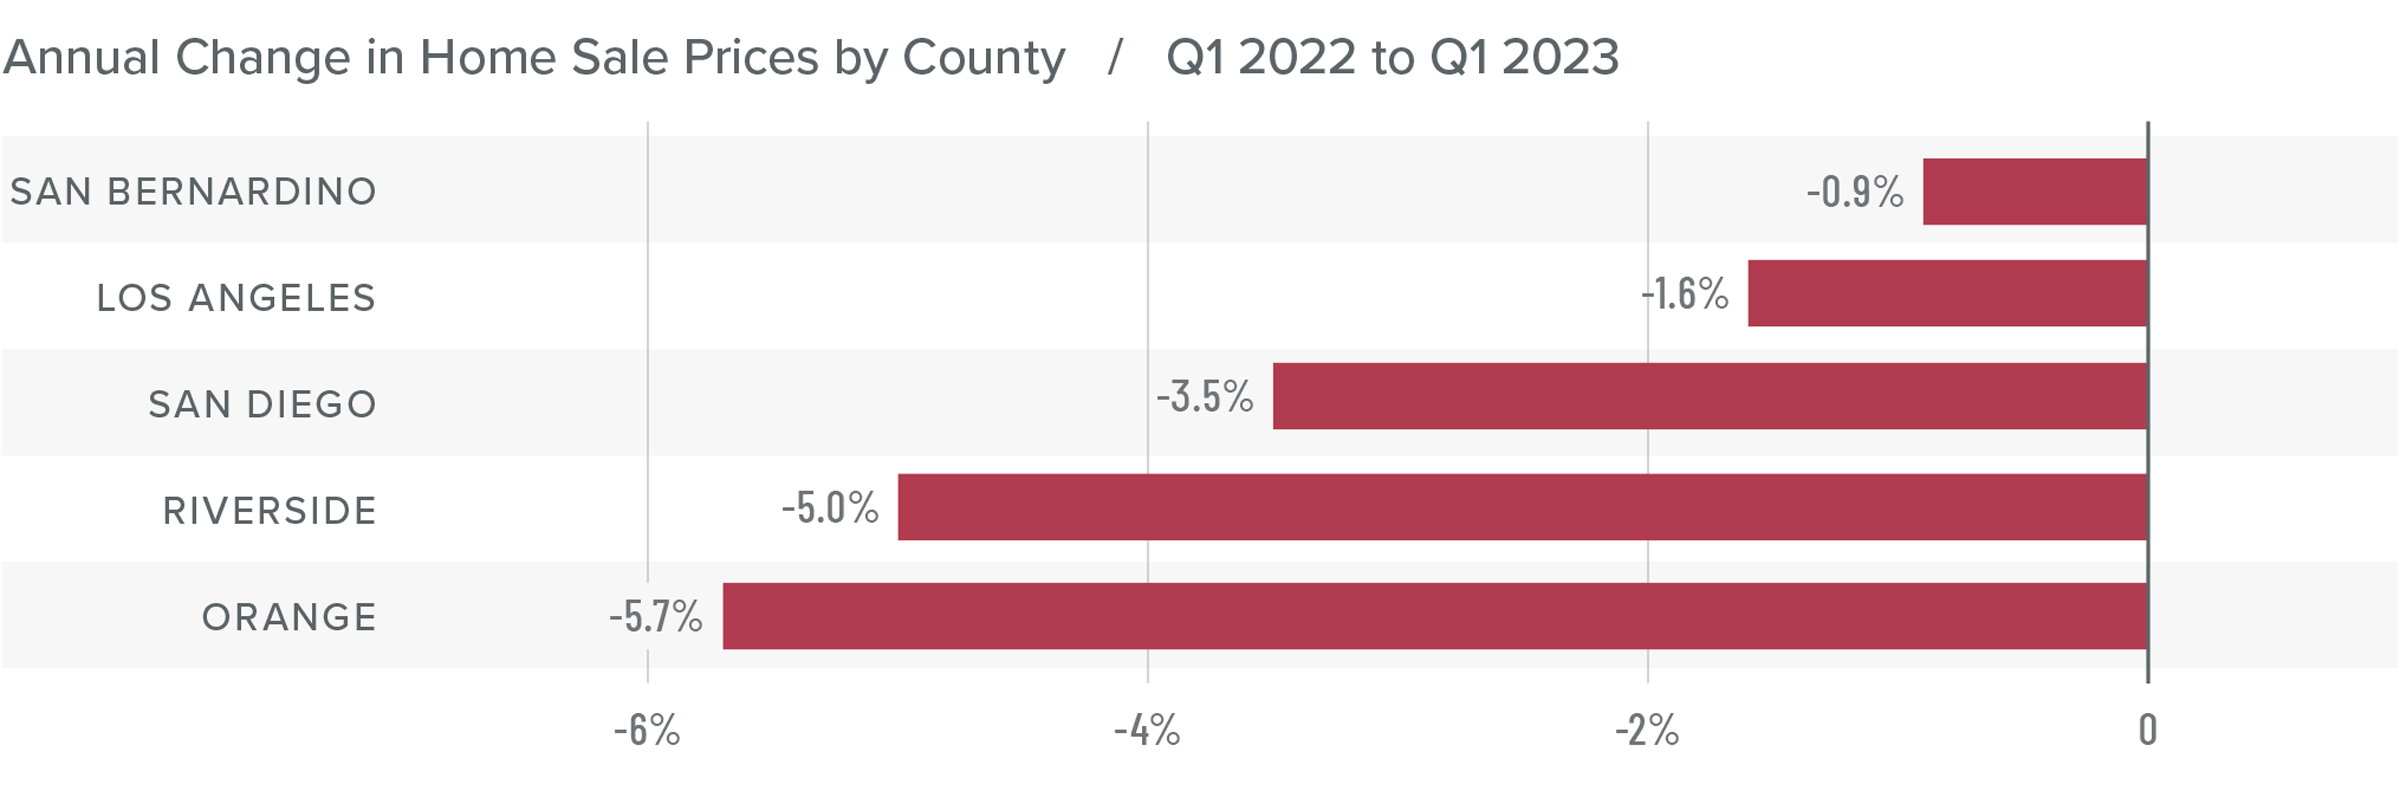
Southern California Home Prices
❱ Compared to the same period last year, home prices fell 2.5%. However, prices were 1.9% higher than in the fourth quarter of 2022.
❱ Affordability remains a significant issue, which has been exacerbated by elevated financing costs. That said, median listing prices in the quarter are up in every market other than San Bernardino, which suggests that home sellers may be starting to think that the worst of the price correction is behind them.
❱ Year over year, prices fell across the region but rose in all markets compared to the final quarter of 2022. Of note is that price growth was very solid in San Diego, Riverside, and Orange counties.
❱ While I expect mortgage rates to start stabilizing as we move toward summer, I think there will be some additional downward pressure on home prices. That said, things should start to turn around again in the second half of the year with a return to rising home prices.
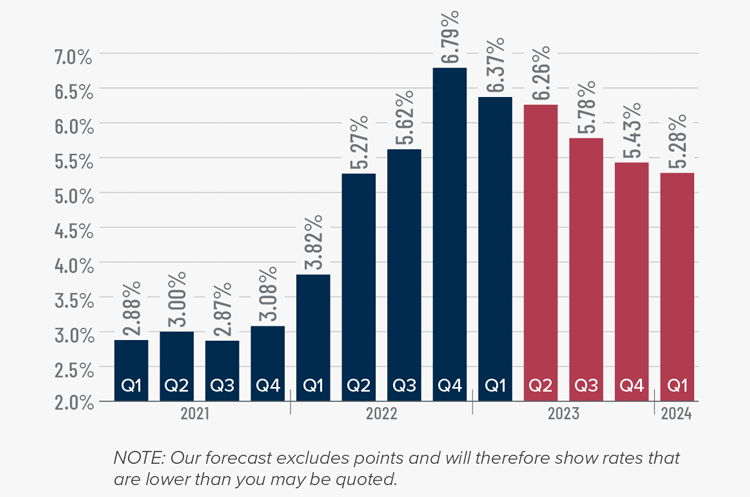
Mortgage Rates
Rates in the first quarter of 2023 were far less volatile than last year, even with the brief but significant impact of early March’s banking crisis. It appears that buyers are jumping in when rates dip, which was the case in mid-January and again in early February.
Even with the March Consumer Price Index report showing inflation slowing, I still expect the Federal Reserve to raise short-term rates one more time following their May meeting before pausing rate increases. This should be the catalyst that allows mortgage rates to start trending lower at a more consistent pace than we have seen so far this year. My current forecast is that rates will continue to move lower with occasional spikes, and that they will hold below 6% in the second half of this year.
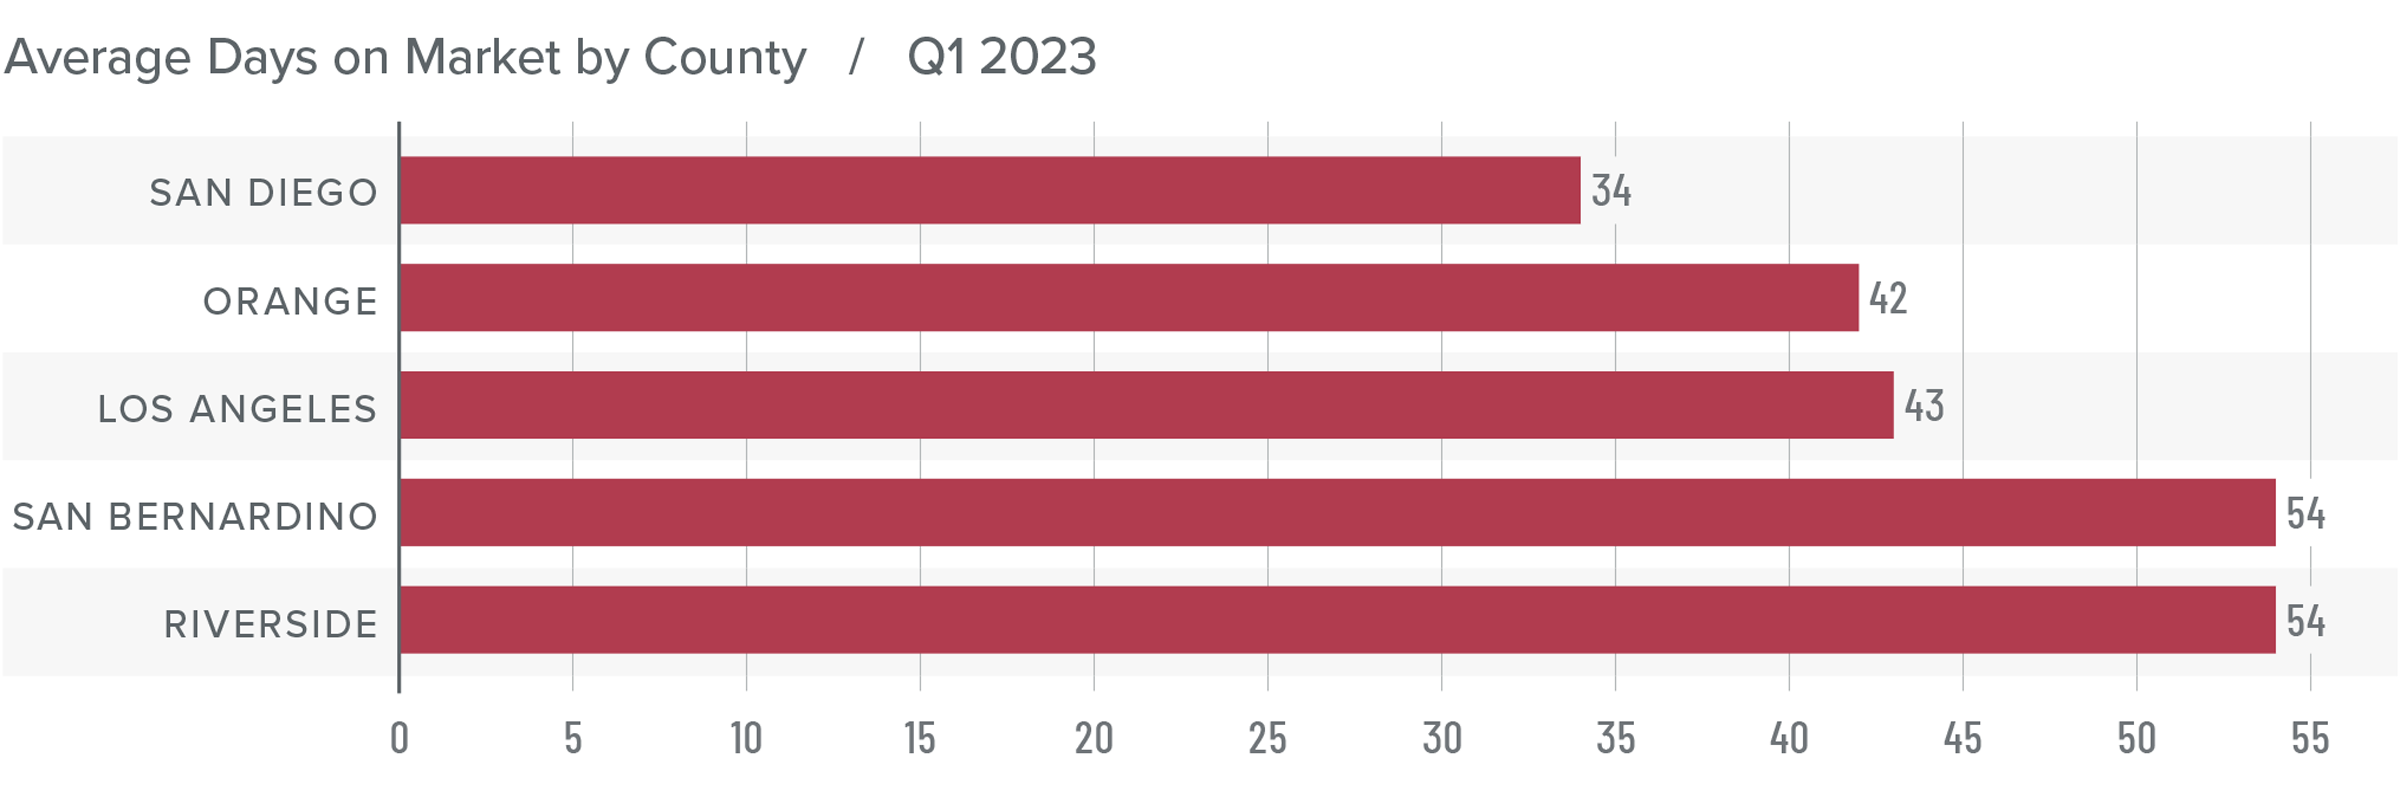
Southern California Days on Market
❱ In the first quarter of 2023, the average time it took to sell a home in the region was 45 days, which is 24 more than in the first quarter of 2022 and 9 more days than in the fourth quarter of last year.
❱ Market time also rose in all counties covered by this report compared to the fourth quarter of 2022.
❱ Homes in San Diego County continue to sell at a faster rate than other markets in the region, but all counties saw market time increase from a year ago.
❱ Higher mortgage rates and lower affordability still have some buyers sidelined. I expect to see increased activity once buyers become confident that mortgage rates have stabilized and that housing values have found a bottom.
Conclusions
This speedometer reflects the state of the region’s real estate market using housing inventory, price gains, home sales, interest rates, and larger economic factors.
The Southern California housing market is still trying to find its footing. Mortgage rates are not only still at elevated levels, but they are also moving erratically depending on events in the broader economy (e.g. inflation, bank failures, etc.) Although sellers seem to be more confident, buyers are remaining cautious, which suggests that the market recovery will take more time.
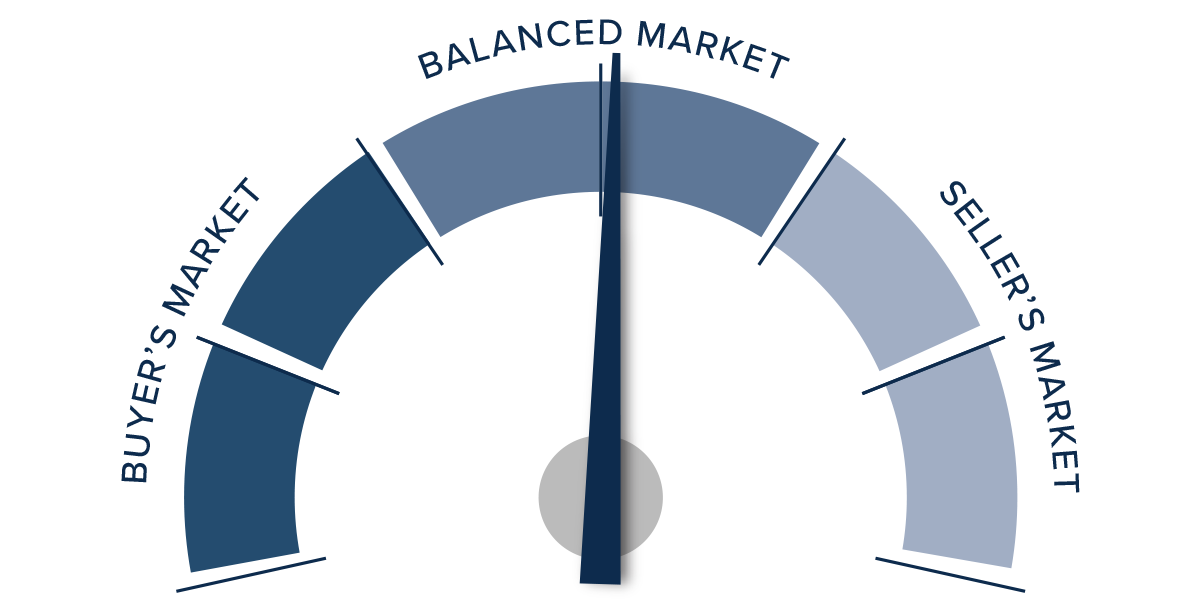
Lower inventory levels, higher pending sales, higher listing and sale prices, and an improving absorption rate all favor sellers. However, the market is not completely in their favor. As such, I have left the needle in the “balanced” section of the speedometer. I have tilted it slightly toward home sellers though as there continues to be strong demand for appropriately priced, well-located, and well-appointed homes.
About Matthew Gardner
As Chief Economist for Windermere Real Estate, Matthew Gardner is responsible for analyzing and interpreting economic data and its impact on the real estate market on both a local and national level. Matthew has over 30 years of professional experience both in the U.S. and U.K.
In addition to his day-to-day responsibilities, Matthew sits on the Washington State Governors Council of Economic Advisors; chairs the Board of Trustees at the Washington Center for Real Estate Research at the University of Washington; and is an Advisory Board Member at the Runstad Center for Real Estate Studies at the University of Washington where he also lectures in real estate economics.

Matthew Gardner’s Top 10 Predictions for 2023
This video shows Windermere Chief Economist Matthew Gardner’s Top 10 Predictions for 2023. Each month, he analyzes the most up-to-date U.S. housing data to keep you well-informed about what’s going on in the real estate market.
Matthew Gardner’s Top 10 Predictions for 2023
1. There Is No Housing Bubble
Mortgage rates rose steeply in 2022 which, when coupled with the massive run-up in home prices, has some suggesting that we are recreating the housing bubble of 2007. But that could not be further from the truth.
Over the past couple of years, home prices got ahead of themselves due to a perfect storm of massive pandemic-induced demand and historically low mortgage rates. While I expect year-over-year price declines in 2023, I don’t believe there will be a systemic drop in home values. Furthermore, as financing costs start to pull back in 2023, I expect that will allow prices to resume their long-term average pace of growth.
2. Mortgage Rates Will Drop
Mortgage rates started to skyrocket at the start of 2022 as the Federal Reserve announced their intent to address inflation. While the Fed doesn’t control mortgage rates, they can influence them, which we saw with the 30-year rate rising from 3.2% in early 2022 to over 7% by October.
Their efforts so far have yet to significantly reduce inflation, but they have increased the likelihood of a recession in 2023. Therefore, early in the year I expect the Fed to start pulling back from their aggressive policy stance, and this will allow rates to begin slowly stabilizing. Rates will remain above 6% until the fall of 2023 when they should dip into the high 5% range. While this is higher than we have become used to, it’s still more than 2% lower than the historic average.
3. Don’t Expect Inventory to Grow Significantly
Although inventory levels rose in 2022, they are still well below their long-term average. In 2023 I don’t expect a significant increase in the number of homes for sale, as many homeowners do not want to lose their low mortgage rate. In fact, I estimate that 25-30 million homeowners have mortgage rates around 3% or lower. Of course, homes will be listed for sale for the usual reasons of career changes, death, and divorce, but the 2023 market will not have the normal turnover in housing that we have seen in recent years.
4. No Buyer’s Market But a More Balanced One
With supply levels expected to remain well below normal, it’s unlikely that we will see a buyer’s market in 2023. A buyer’s market is usually defined as having more than six months of available inventory, and the last time we reached that level was in 2012 when we were recovering from the housing bubble. To get to six months of inventory, we would have to reach two million listings, which hasn’t happened since 2015. In addition, monthly sales would have to drop below 325,000, a number we haven’t seen in over a decade. While a buyer’s market in 2023 is unlikely, I do expect a return to a far more balanced one.
5. Sellers Will Have to Become More Realistic
We all know that home sellers have had the upper hand for several years, but those days are behind us. That said, while the market has slowed, there are still buyers out there. The difference now is that higher mortgage rates and lower affordability are limiting how much buyers can pay for a home. Because of this, I expect listing prices to pull back further in the coming year, which will make accurate pricing more important than ever when selling a home.
6. Workers Return to Work (Sort of)
The pandemic’s impact on where many people could work was profound, as it allowed buyers to look further away from their workplaces and into more affordable markets. Many businesses are still determining their long-term work-from-home policies, but in the coming year I expect there will be more clarity for workers. This could be the catalyst for those who have been waiting to buy until they know how often they’re expected to work at the office.
7. New Construction Activity Is Unlikely to Increase
Permits for new home construction are down by over 17% year over year, as are new home starts. I predict that builders will pull back further in 2023, with new starts coming in at a level we haven’t seen since before the pandemic.
Builders will start seeing some easing in the supply chain issues that hit them hard over the past two years, but development costs will still be high. Trying to balance homebuilding costs with what a consumer can pay (given higher mortgage rates) will likely lead builders to slow activity. This will actually support the resale market, as fewer new homes will increase the demand for existing homes.
8. Not All Markets Are Created Equal
Markets where home price growth rose the fastest in recent years are expected to experience a disproportionate swing to the downside. For example, markets in areas that had an influx of remote workers, who flocked to cheaper housing during the pandemic, will likely see prices fall by a greater percentage than other parts of the country. That said, even those markets will start to see prices stabilize by the end of 2023 and resume a more reasonable pace of price growth.
9. Affordability Will Continue to Be a Major Issue
In most markets, home prices will not increase in 2023, but any price drop will not be enough to make housing more affordable. And with mortgage rates remaining higher than they’ve been in over a decade, affordability will continue to be a problem in the coming year, which is a concerning outlook for first-time buyers.
Over the past two years, many renters have had aspirations of buying but the timing wasn’t quite right for them. With both prices and mortgage rates spiraling upward in 2022, it’s likely that many renters are now in a situation where the dream of homeownership has gone. That’s not to say they will never be able to buy a home, just that they may have to wait a lot longer than they had hoped.
10. Government Needs to Take Housing More Seriously
Over the past two years, the market has risen to such an extent that it has priced out millions of potential home buyers. With a wave of demand coming from Millennials and Gen Z, the pace of housing production must increase significantly, but many markets simply don’t have enough land to build on. This is why I expect more cities, counties, and states to start adjusting their land use policies to free up more land for housing.
But it’s not just land supply that can help. Elected officials can assist housing developers by utilizing Tax Increment Financing tools, whereby the government reimburses a private developer as incremental taxes are generated from housing development. There are many tools like this at the government’s disposal to help boost housing supply, and I sincerely hope that they start to take this critical issue more seriously.
About Matthew Gardner
As Chief Economist for Windermere Real Estate, Matthew Gardner is responsible for analyzing and interpreting economic data and its impact on the real estate market on both a local and national level. Matthew has over 30 years of professional experience both in the U.S. and U.K.
In addition to his day-to-day responsibilities, Matthew sits on the Washington State Governors Council of Economic Advisors; chairs the Board of Trustees at the Washington Center for Real Estate Research at the University of Washington; and is an Advisory Board Member at the Runstad Center for Real Estate Studies at the University of Washington where he also lectures in real estate economics.

Q3 2022 Southern California Real Estate Market Update
The following analysis of select counties of the Southern California real estate market is provided by Windermere Real Estate Chief Economist Matthew Gardner. We hope that this information may assist you with making better-informed real estate decisions. For further information about the housing market in your area, please don’t hesitate to contact your Windermere Real Estate agent.
Regional Economic Overview
The employment market grew by 465,000 jobs over the past 12 months. However, the pace of job creation has been slowing and more recently the region has seen total employment levels drop. I am not overly concerned by this, as state data at the county level is not adjusted for seasonality, and I anticipate more jobs will be added as we move through the fall. Total employment in the counties covered by this report is now only 340,000 short of the pre-pandemic peak, having recovered 96.7% of the jobs that were lost. Los Angeles County still has the largest shortfall (-335,700), followed by Orange County (-41,500) and San Diego County (-15,400). Riverside and San Bernardino counties remain well above pre-pandemic employment levels. The region’s unemployment rate in August was 4.2%, down from 7.8% a year ago. The lowest rates were in Orange County (3%) and San Diego County (3.4%).
Southern California Home Sales
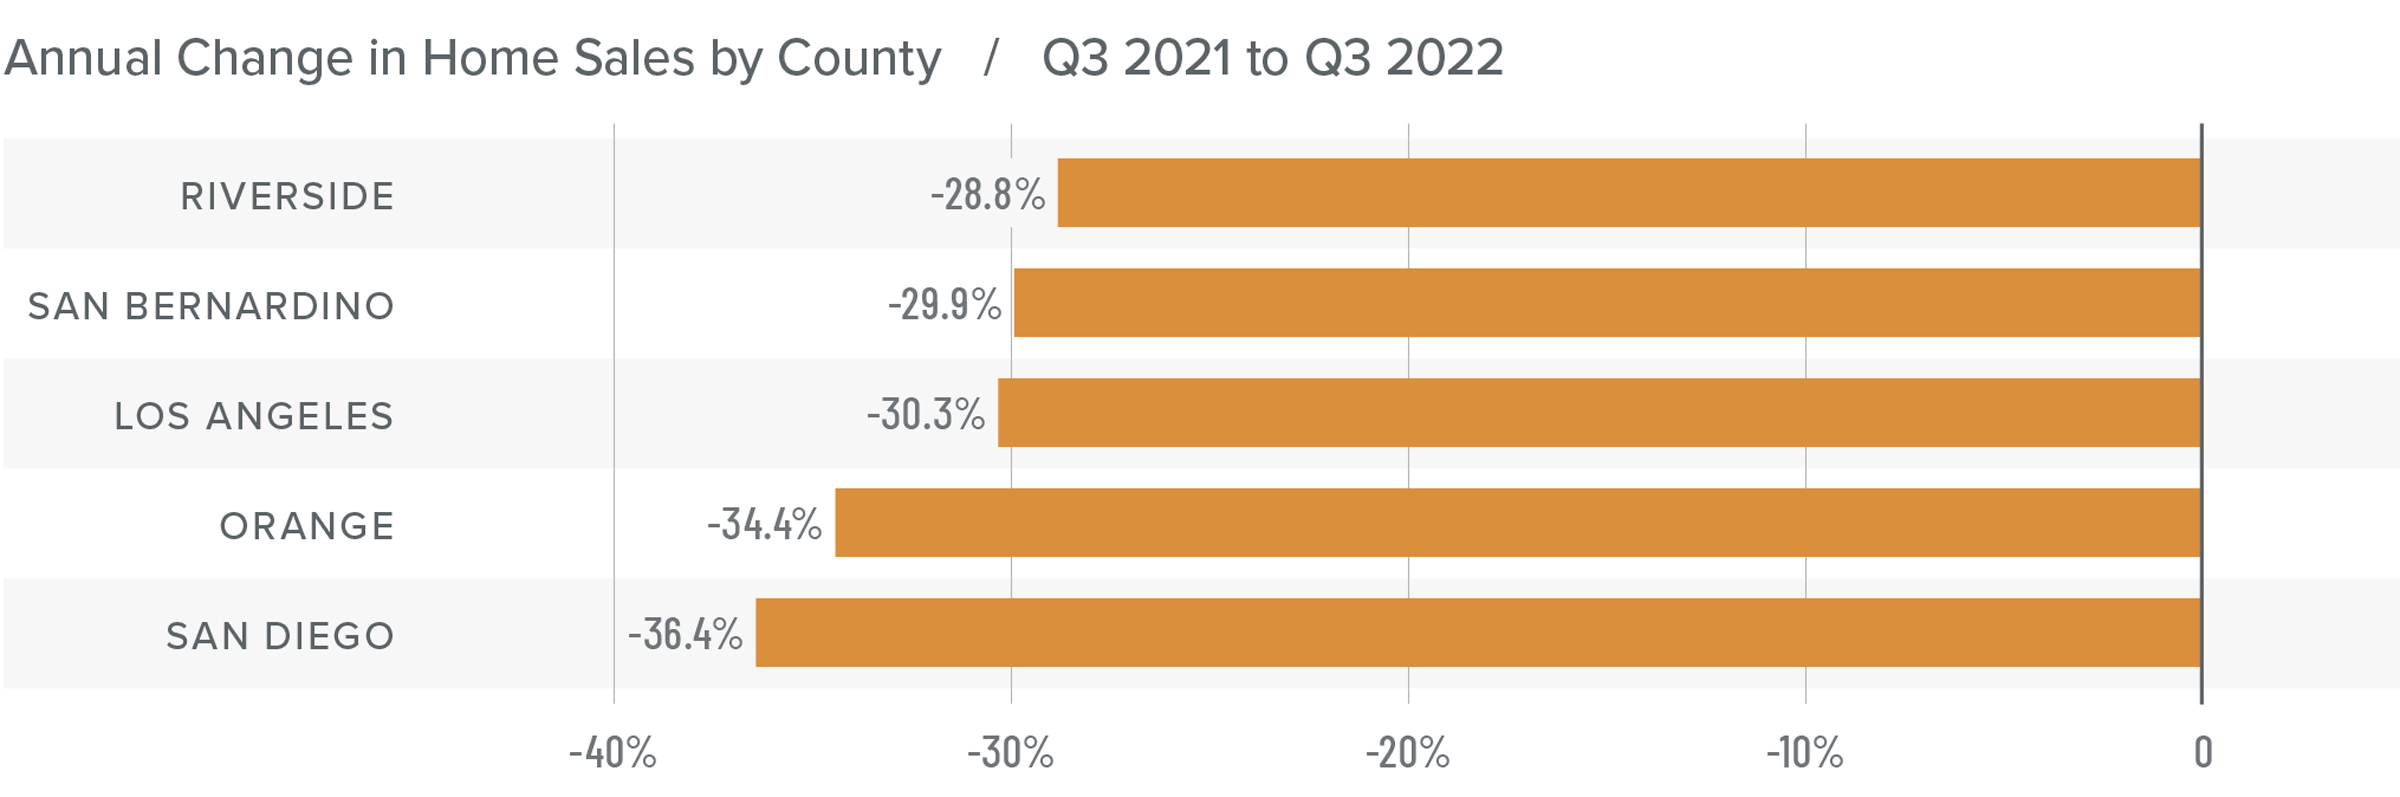
❱ In the third quarter, 38,356 homes sold, which is down 31.8% from a year ago and 19.4% less than the second quarter of the year.
❱ Pending home sales, which are an indicator of future closings, were down 16.2% from the second quarter, suggesting that closed sales in the final quarter of this year may disappoint.
❱ Sales fell the most in San Diego County, but all markets saw significant declines. Relative to the second quarter, transactions were lower across the board, with Riverside County experiencing the greatest decline (-24.1%).
❱ Listing activity rose an average of 41.6% compared to the second quarter. With more choice in the market and median list prices down 6.8% from the second quarter, it seems that many would-be buyers are sitting on the fence to see if prices will fall further.
Southern California Home Prices
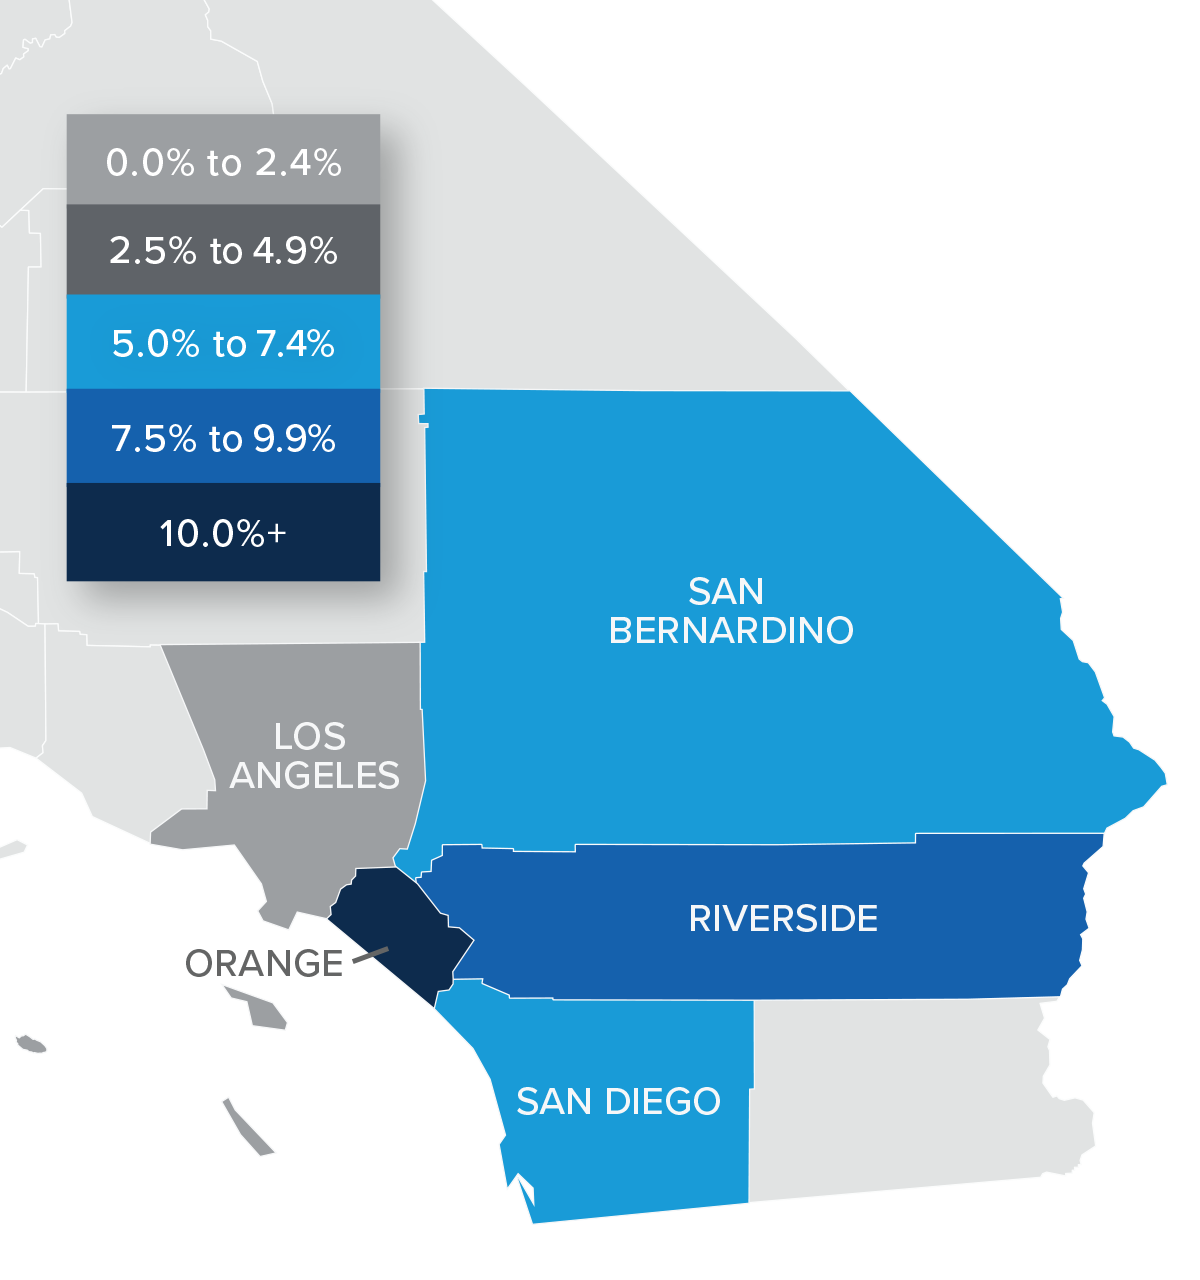
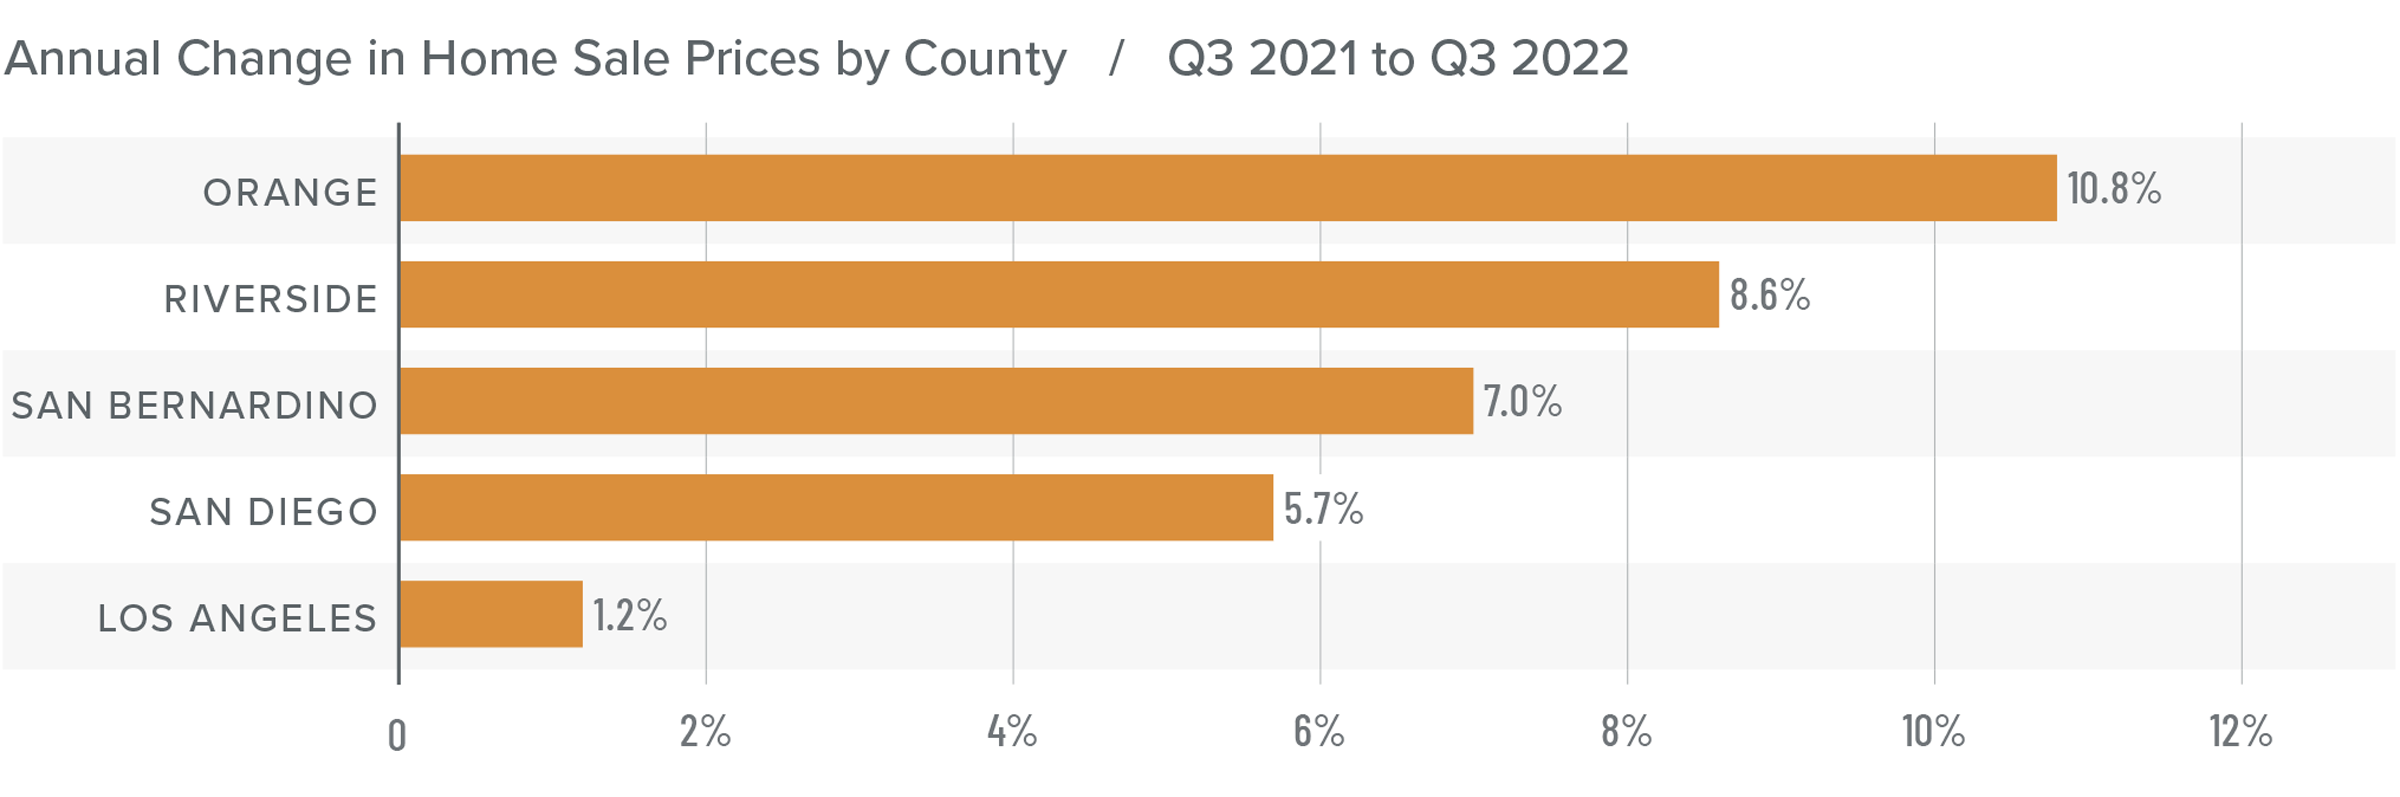
❱ Home sale prices in the quarter rose 4.6% from a year ago but were 7.1% lower than in the second quarter of this year.
❱ Rising mortgage rates are clearly starting to impact the market. This, combined with higher inventory levels, will lead sale prices to continue pulling back.
❱ The region saw double-digit price growth in Orange County, but the overall trend has shown price growth starting to slow. In fact, prices in Los Angeles County rose by only 1.2% year over year.
❱ A period of reversion was inevitable, especially because artificially low mortgage rates could not continue forever. It’s worth remembering that owners saw home values skyrocket over the past few years. This adjustment to home values will only be temporary, and owners still have ample equity in their homes.
Mortgage Rates
This remains an uncertain period for mortgage rates. When the Federal Reserve slowed bond purchases in 2013, investors were accused of having a “taper tantrum,” and we are seeing a similar reaction today. The Fed appears to be content to watch the housing market go through a period of pain as they throw all their tools at reducing inflation.
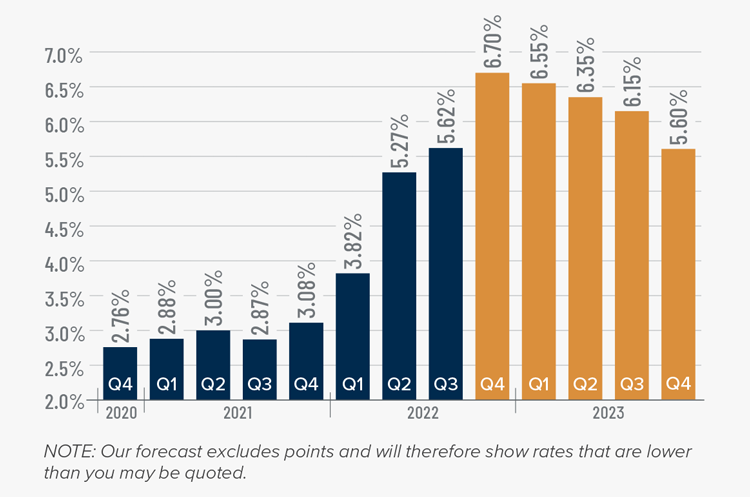
As a result, mortgage rates are out of sync with treasury yields, which not only continues to push rates much higher, but also creates violent swings in both directions. My current forecast calls for rates to peak in the fourth quarter of this year before starting to slowly pull back. That said, they will remain in the 6% range until the end of 2023.
Southern California Days on Market
❱ In the third quarter of 2022, the average time it took to sell a home in the region was 25 days, which is 7 more than a year ago and 9 more days than in the second quarter.
❱ Compared to the second quarter of 2022, market time rose in all counties covered by this report.
❱ Homes in San Diego County continue to sell at a faster rate than other markets in the region. All counties saw market time increase year over year.
❱ More homes for sale and higher financing costs have led to increased days on market. That said, it’s important to put the data into perspective; in the third quarter of 2019, the average market time in the region was 42 days.

Conclusions
This speedometer reflects the state of the region’s real estate market using housing inventory, price gains, home sales, interest rates, and larger economic factors.
The housing market has entered a period of transition following the overheated conditions in 2020-2021. Though the headline numbers are far from buoyant, it’s important to understand that the region is only reverting back to where it was before the pandemic. Any belief that the area is going to experience the same meltdown as it went through in the late 2000s is simply inaccurate. There will be an uncomfortable period, but a return to fundamentals is necessary.

As such, I have moved the needle more in favor of buyers as the region continues to trend back toward balance.
About Matthew Gardner
As Chief Economist for Windermere Real Estate, Matthew Gardner is responsible for analyzing and interpreting economic data and its impact on the real estate market on both a local and national level. Matthew has over 30 years of professional experience both in the U.S. and U.K.
In addition to his day-to-day responsibilities, Matthew sits on the Washington State Governors Council of Economic Advisors; chairs the Board of Trustees at the Washington Center for Real Estate Research at the University of Washington; and is an Advisory Board Member at the Runstad Center for Real Estate Studies at the University of Washington where he also lectures in real estate economics.

Windermere Tower Properties Celebrates a New Chapter of Leadership
Windermere Real Estate Tower Properties announces the addition of Lauren Sawyer as co-owner with Brent Lee of the long serving Riverside-based real estate company.
Collette Lee, founder of Tower Realty, decided to sell her ownership position to her daughter to focus on serving her clients with their real estate needs, while leading the Riverside Arts Academy, a local non-profit that provides free and low-cost music instruction to area youth. Collette shared the announcement at a sales meeting, “I am so pleased my daughter will be joining Brent as co-owner. It has been a labor of love and I know together they will continue to grow the company that was founded on professionalism, service, and community. I pray for the continued success of each of you. I will still be doing what I love, serving my clients and community.”
History
Collette started her boutique real estate company in 1989 with a vision to create a locally minded, community oriented real estate firm composed of highly trained and professional agents. Her son Brent took over day to day operations and became the co-owner and managing broker in 2012 when Tower Realty joined the Windermere Real Estate brand as Windermere Tower Properties.
Lauren joined the firm in 2008 to help lead the front office and accounting department. She joined her brother Brent’s sales team in 2014, and they have been working together ever since. Lauren shared, “I am excited to work with my brother in this new role, and I am grateful to my mom for entrusting me with the company she has given so much to.”
About Windermere Tower Properties
Brent and Lauren are proud of the talented Windermere agents and staff and are elated to provide a variety of additional supports and resources to help agents grow their business. “Together with our dynamic leadership team, including James Monks as Sales Manager and Scott Gieser as Director of Professional Development, we want to add more value to our business model and provide more training and support for our agents so that they can exceed their goals. We have fostered a collaborative culture not often found in a sales-oriented business, and I think that is the key to success in this transition market,” shared Brent.
Windermere Tower Properties is an independently owned and operated firm that is part of the Windermere Real Estate network. For 50 years, Windermere has put integrity and professionalism at the heart of our business. These cornerstones, along with our commitment to building thriving communities, has helped Windermere grow into one of the largest and most respected real estate brands in the country, with more than 300 offices and 7,000 agents throughout the Western U.S. and Mexico.
Join Our Team
If you’re interested in learning more about Windermere Tower Properties, their agents and what they are doing to create thriving communities, visit WindermereTower.com or check out their social media. Interested in joining their team of extraordinary agents? Contact James Monks (951) 369-8002.

Q2 2022 Southern California Real Estate Market Update
The following analysis of select counties of the Southern California real estate market is provided by Windermere Real Estate Chief Economist Matthew Gardner. We hope that this information may assist you with making better-informed real estate decisions. For further information about the housing market in your area, please don’t hesitate to contact your Windermere Real Estate agent.
Regional Economic Overview
Total employment in the counties covered by this report has risen more than 600,000 jobs over the past year, recovering 97.3% of the jobs lost due to the pandemic. Unsurprisingly, Los Angeles County still has the largest shortfall (-254,000 jobs), followed by Orange County (-44,100) and San Diego County (-15,000). Riverside and San Bernardino counties are now well above pre-pandemic employment levels. The region’s unemployment rate in May was 3.6%, down from 8.2% a year ago. The lowest rates were in Orange County (2.4%) and San Diego County (2.7%). The highest unemployment rate was in Los Angeles County, where 4.5% of the labor force was without a job. The Inland Empire continues to outperform, and I am hopeful that the rest of the region will return to pre-pandemic employment levels by the end of the year. However, it’s likely that Los Angeles County may take somewhat longer to fully recover due to its size.
Southern California Home Sales
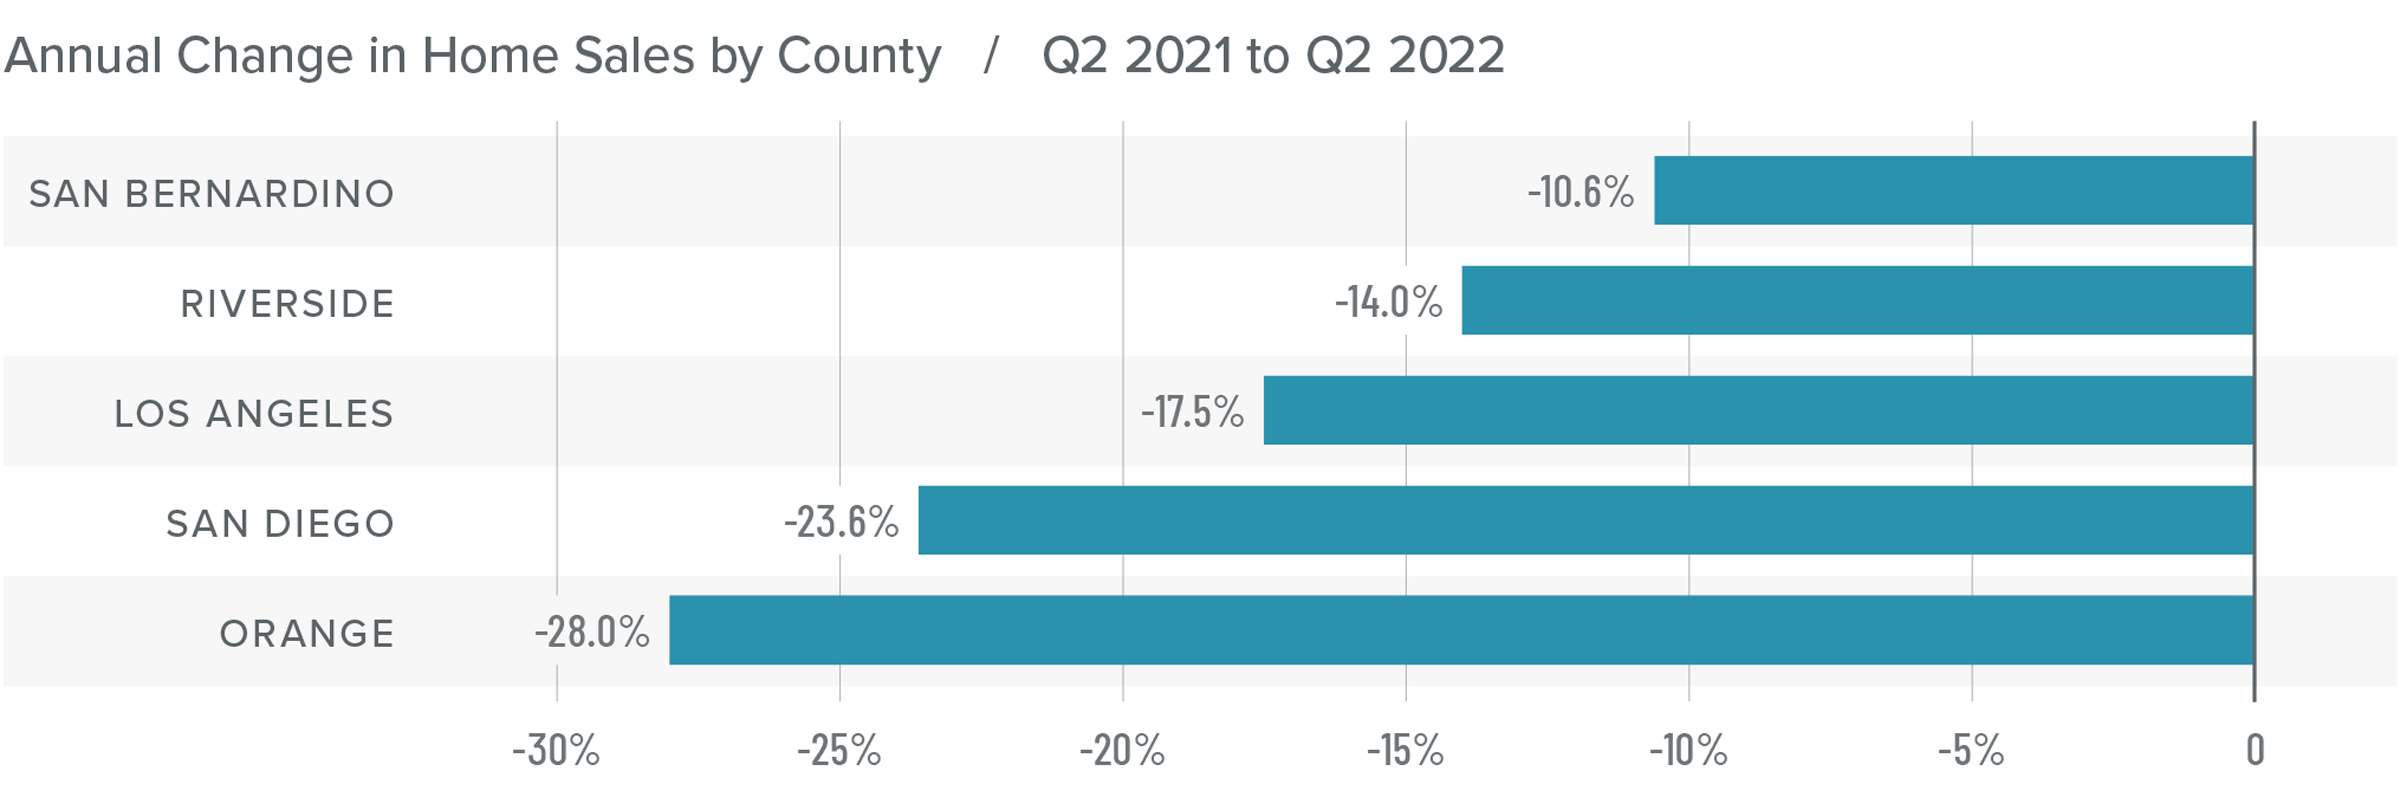
❱ In the second quarter, 47,596 homes sold, down 19% from a year ago but up 13.1% compared to the first quarter of the year.
❱ Pending home sales, which are an indicator of future closings, were down modestly from the first quarter. However, I still expect that the summer will see a decent number of sales.
❱ The largest drop in sales was in Orange County, but all markets saw significant declines. That said, the spring market was in place in San Diego, Los Angeles, and Orange counties, which experienced double-digit percentage increases in sales compared to the prior quarter.
❱ Listing activity has risen across the region, which has given buyers more in the way of choice. That may explain, to a certain degree, why pending sales have pulled back; buyers are not feeling as pressured as they were when inventory was very low.
Southern California Home Prices
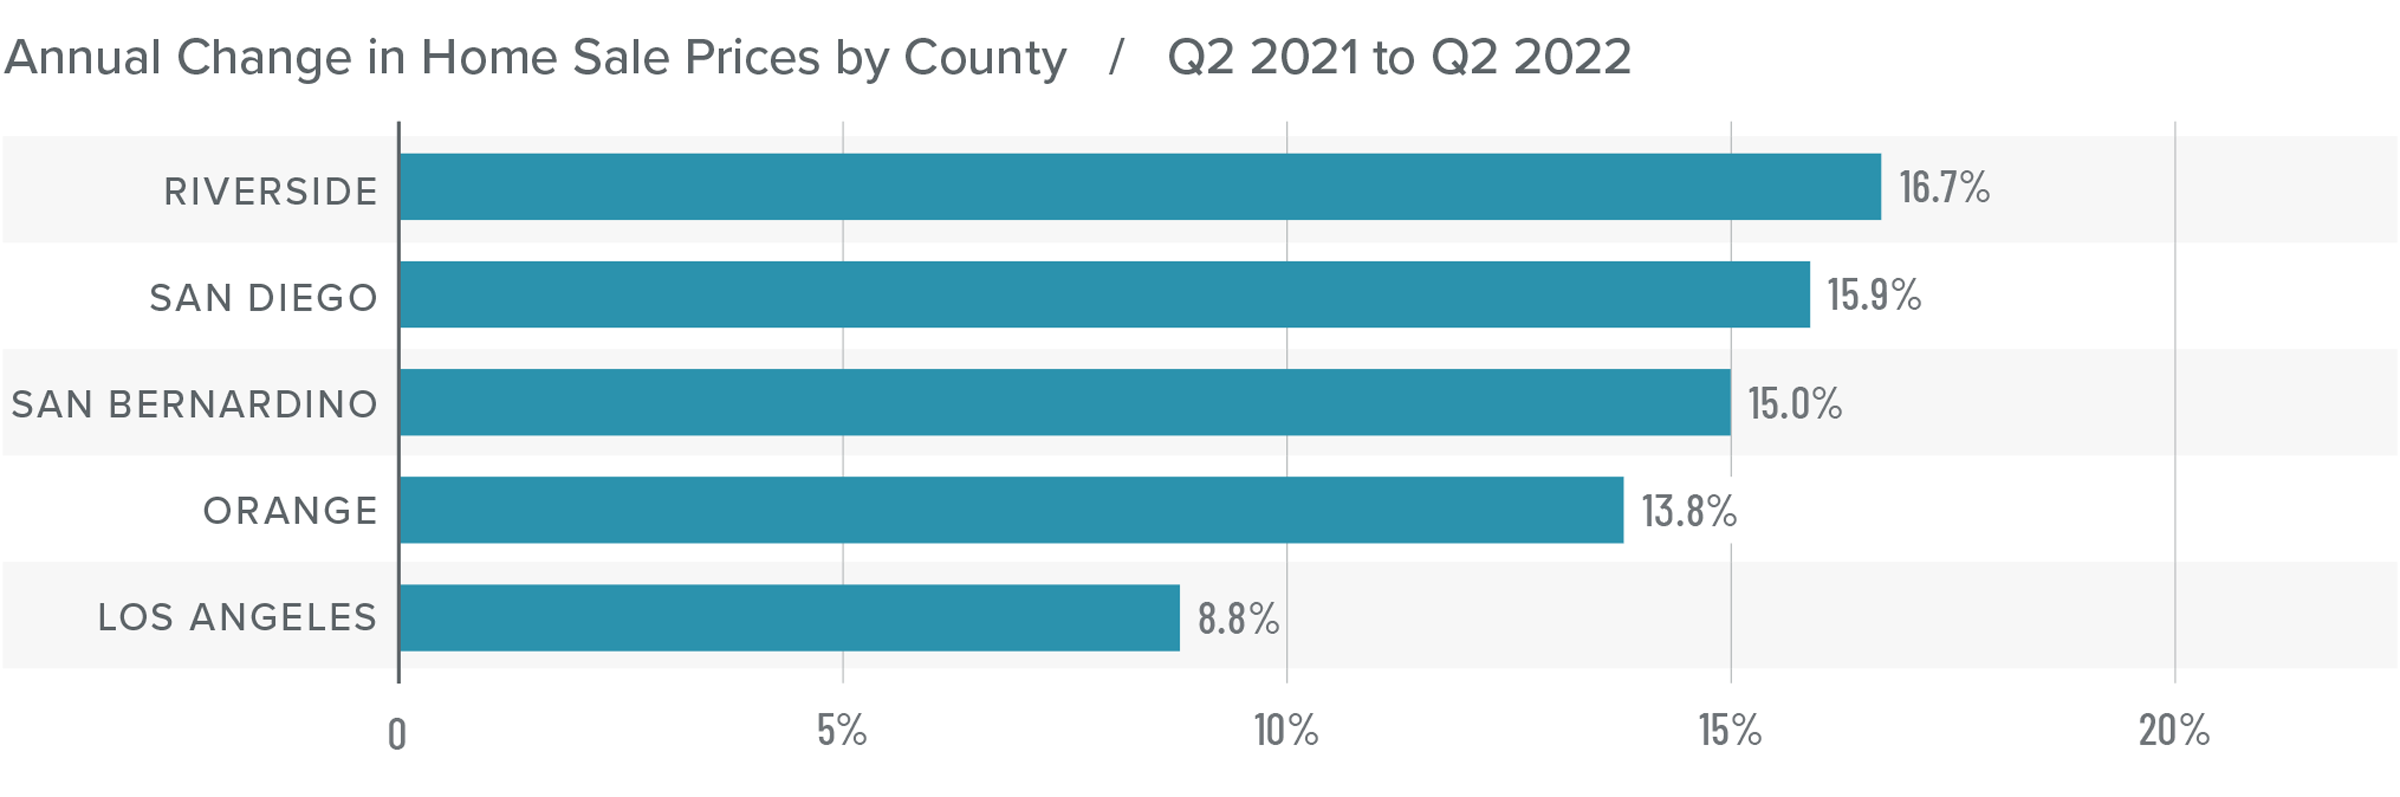
❱ Home prices in the second quarter rose 10.9% compared to a year ago and were 5.4% higher than in first quarter of 2022.
❱ Rising mortgage rates have not had as much of an impact as some expected, but increased financing costs appear to have taken at least some of the heat off the market, as demonstrated by the slowing pace of price growth compared to 2021.
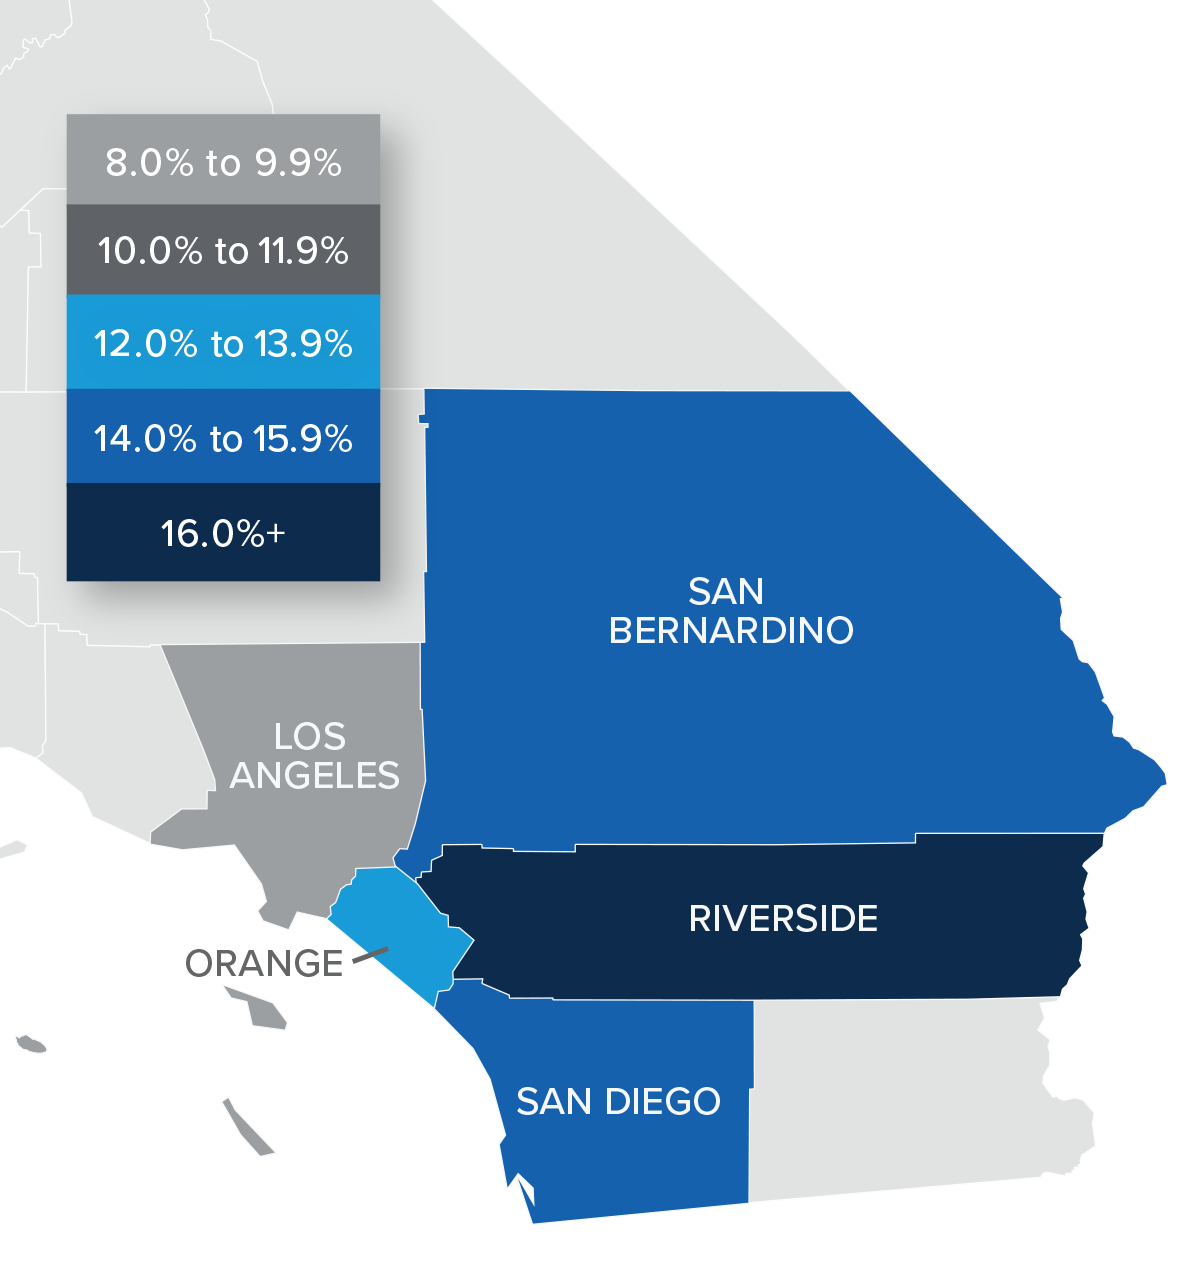
❱ There was double-digit price growth in every county other than Los Angeles. Riverside County led the way with prices rising by 16.7%. The rest of the region also saw very impressive sale price growth.
❱ With relatively high mortgage rates and more homes coming to market, I have started to watch list prices closely. Compared to the first quarter, median list prices are still up an average of 8.7%, suggesting that sellers remain rather bullish.
Mortgage Rates
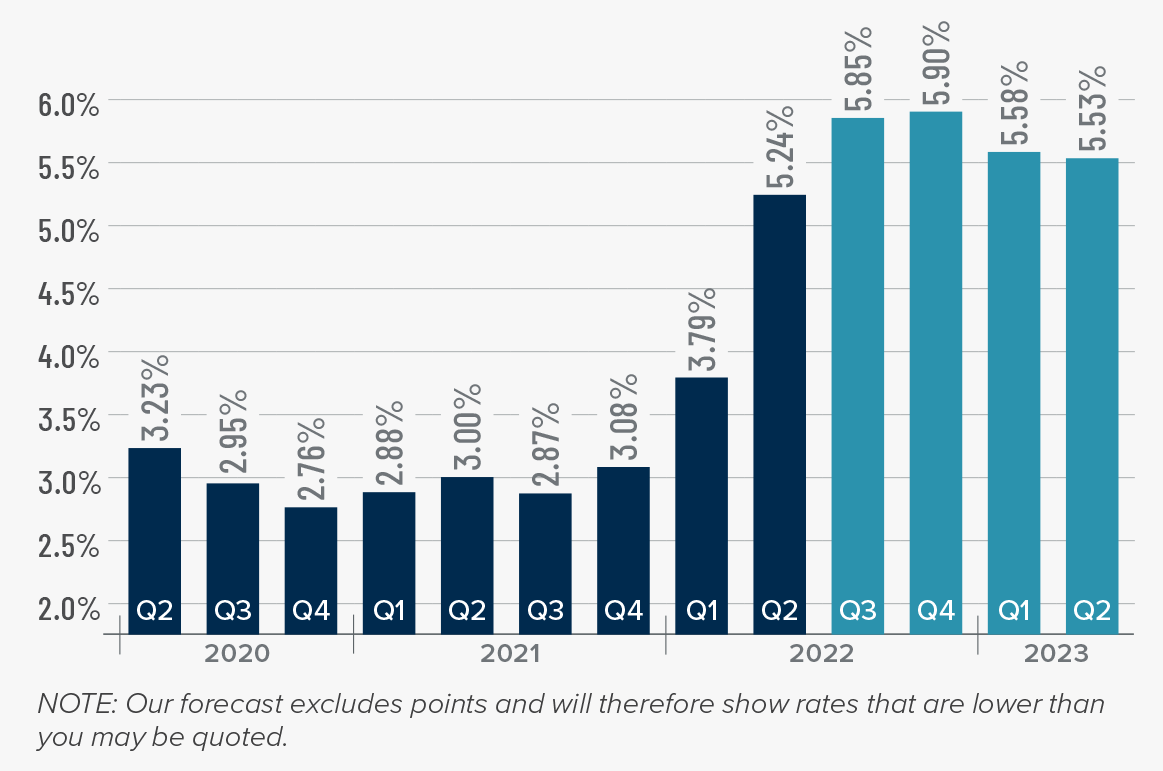
Although mortgage rates did drop in June, the quarterly trend was still moving higher. Inflation—the bane of bonds and, therefore, mortgage rates—has yet to slow, which is putting upward pressure on financing costs.
That said, there are some signs that inflation is starting to soften and if this starts to show in upcoming Consumer Price Index numbers then rates will likely find a ceiling. I am hopeful this will be the case at some point in the third quarter, which is reflected in my forecast.
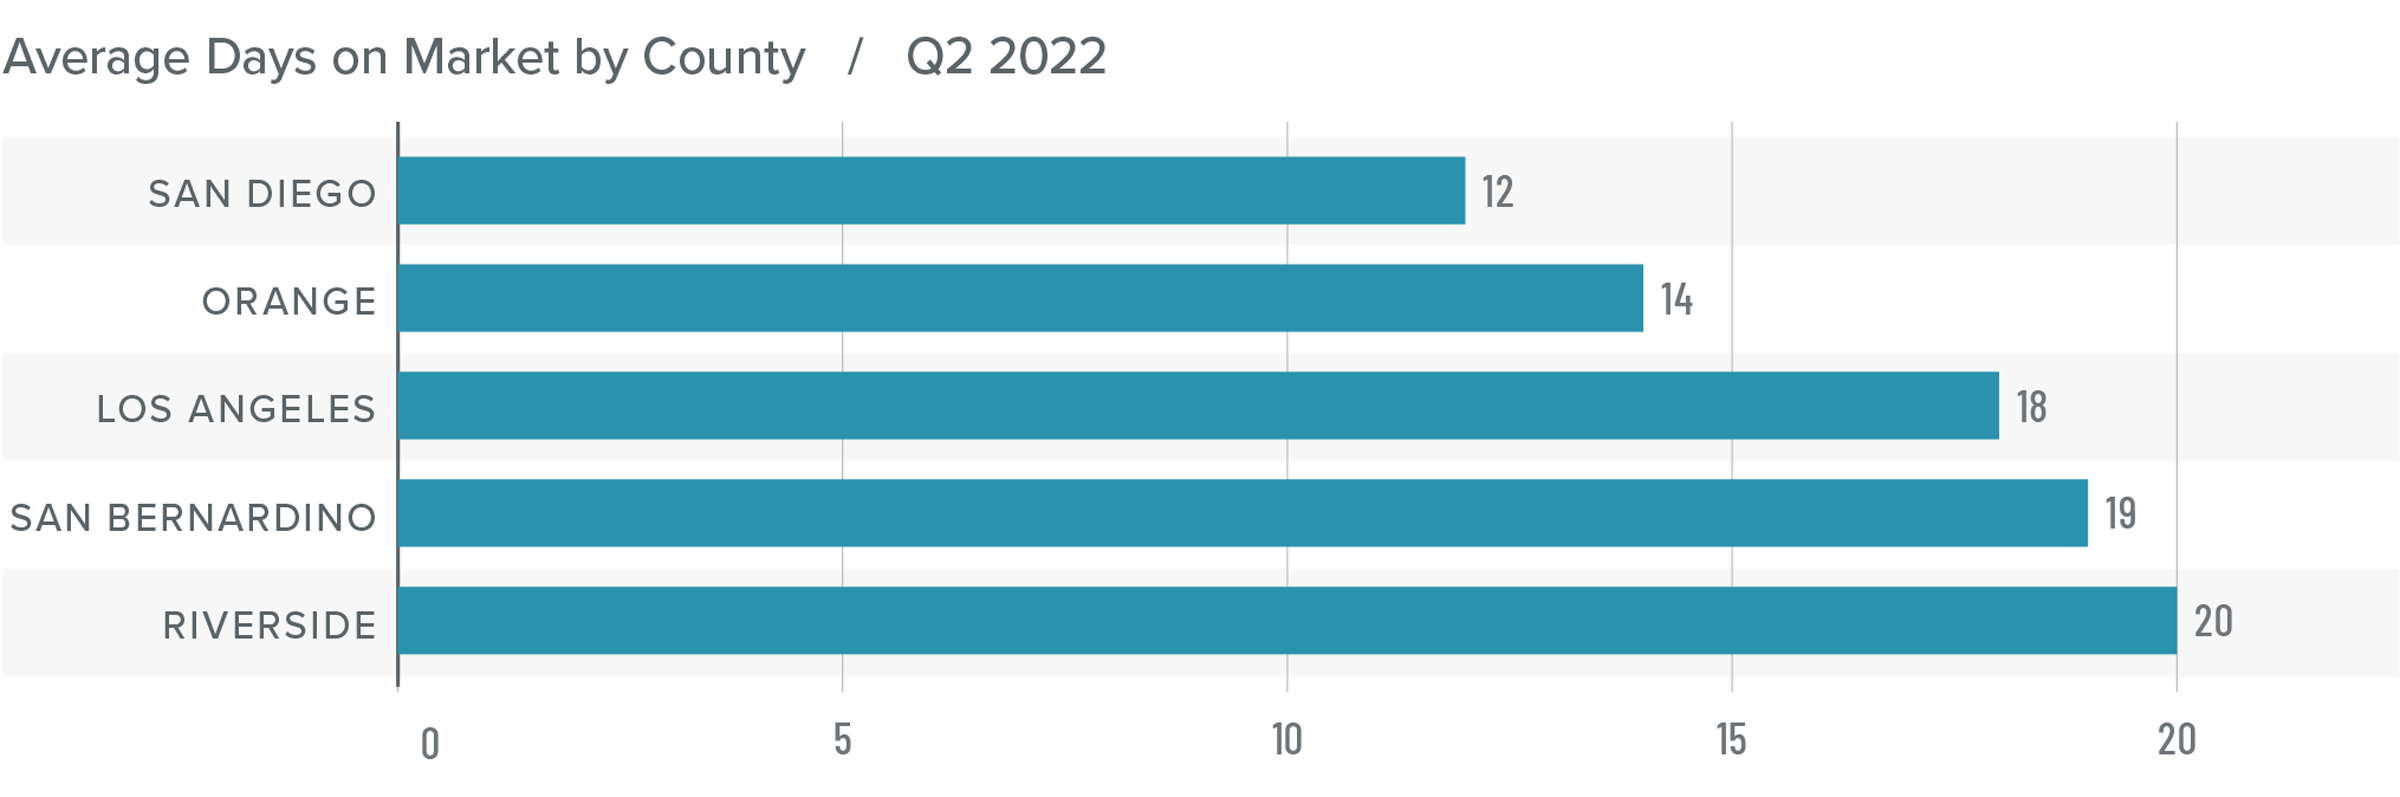
Southern California Days on Market
❱ In the second quarter of 2022, the average time it took to sell a home in the region was 16 days, which was 2 fewer days than a year ago and 5 fewer days than in the first quarter of the year.
❱ Compared to the first quarter of 2022, days on market dropped in all counties covered by this report, which was impressive given the higher number of homes for sale.
❱ Homes in San Diego County continue to sell at a faster rate than other markets in the region. All counties other than San Bernardino (where it took one more day for homes to sell than a year ago) saw market time drop.
❱ With inventory levels rising, some may think that the market is set for a correction, but I disagree. Sales are still higher than in 2019 and it took half the time to sell a home in the second quarter of this year than it did during the same period in 2019.
Conclusions
This speedometer reflects the state of the region’s real estate market using housing inventory, price gains, home sales, interest rates, and larger economic factors.
The trend in the job recovery remains positive, and the prospect of a return of all the jobs lost due to the pandemic is becoming more palpable. The housing market is still performing well, even in the face of higher inventory levels and rising financing costs. That said, the frenetic pace of activity of the past 18 months or so will slow, but not to a degree that is concerning.

More listings led to more sales, which is a little counterintuitive especially given far higher mortgage rates than we’ve seen in years. The market remains favorable to home sellers, and they are still in the driver’s seat.
About Matthew Gardner
As Chief Economist for Windermere Real Estate, Matthew Gardner is responsible for analyzing and interpreting economic data and its impact on the real estate market on both a local and national level. Matthew has over 30 years of professional experience both in the U.S. and U.K.
In addition to his day-to-day responsibilities, Matthew sits on the Washington State Governors Council of Economic Advisors; chairs the Board of Trustees at the Washington Center for Real Estate Research at the University of Washington; and is an Advisory Board Member at the Runstad Center for Real Estate Studies at the University of Washington where he also lectures in real estate economics.