
The following analysis of select counties of the Southern California real estate market is provided by Windermere Real Estate Chief Economist Matthew Gardner. We hope that this information may assist you with making better-informed real estate decisions. For further information about the housing market in your area, please don’t hesitate to contact your Windermere Real Estate agent.
Regional Economic Overview
Following annual revisions to the data, the Southern California market added only 194,000 jobs in 2022, which was far fewer than the over 676,000 added in 2021. The first two months of data for 2023 showed a net loss of 14,800 jobs. Because the data is not adjusted for seasonality, I am not overly concerned by this decline, but I will be watching as we move through the spring to see if declining job growth is becoming pervasive. Total employment in the counties covered by this report is still 266,400 jobs shy of the pre-pandemic peak. Los Angeles County continues to have the largest shortfall of jobs (-260,000), followed by Orange County (-37,100). Job levels in San Diego County match their pre-pandemic peak, while employment levels in the Riverside and San Bernardino markets are each higher by more than 15,000 jobs. The region’s unemployment rate in February was 4.6%, down from 5% at the same time in 2022. The lowest jobless rates were in Orange County (3.4%) and San Diego County (3.7%). The highest was in Los Angeles County, where 5.3% of the workforce was without a job.
Southern California Home Sales
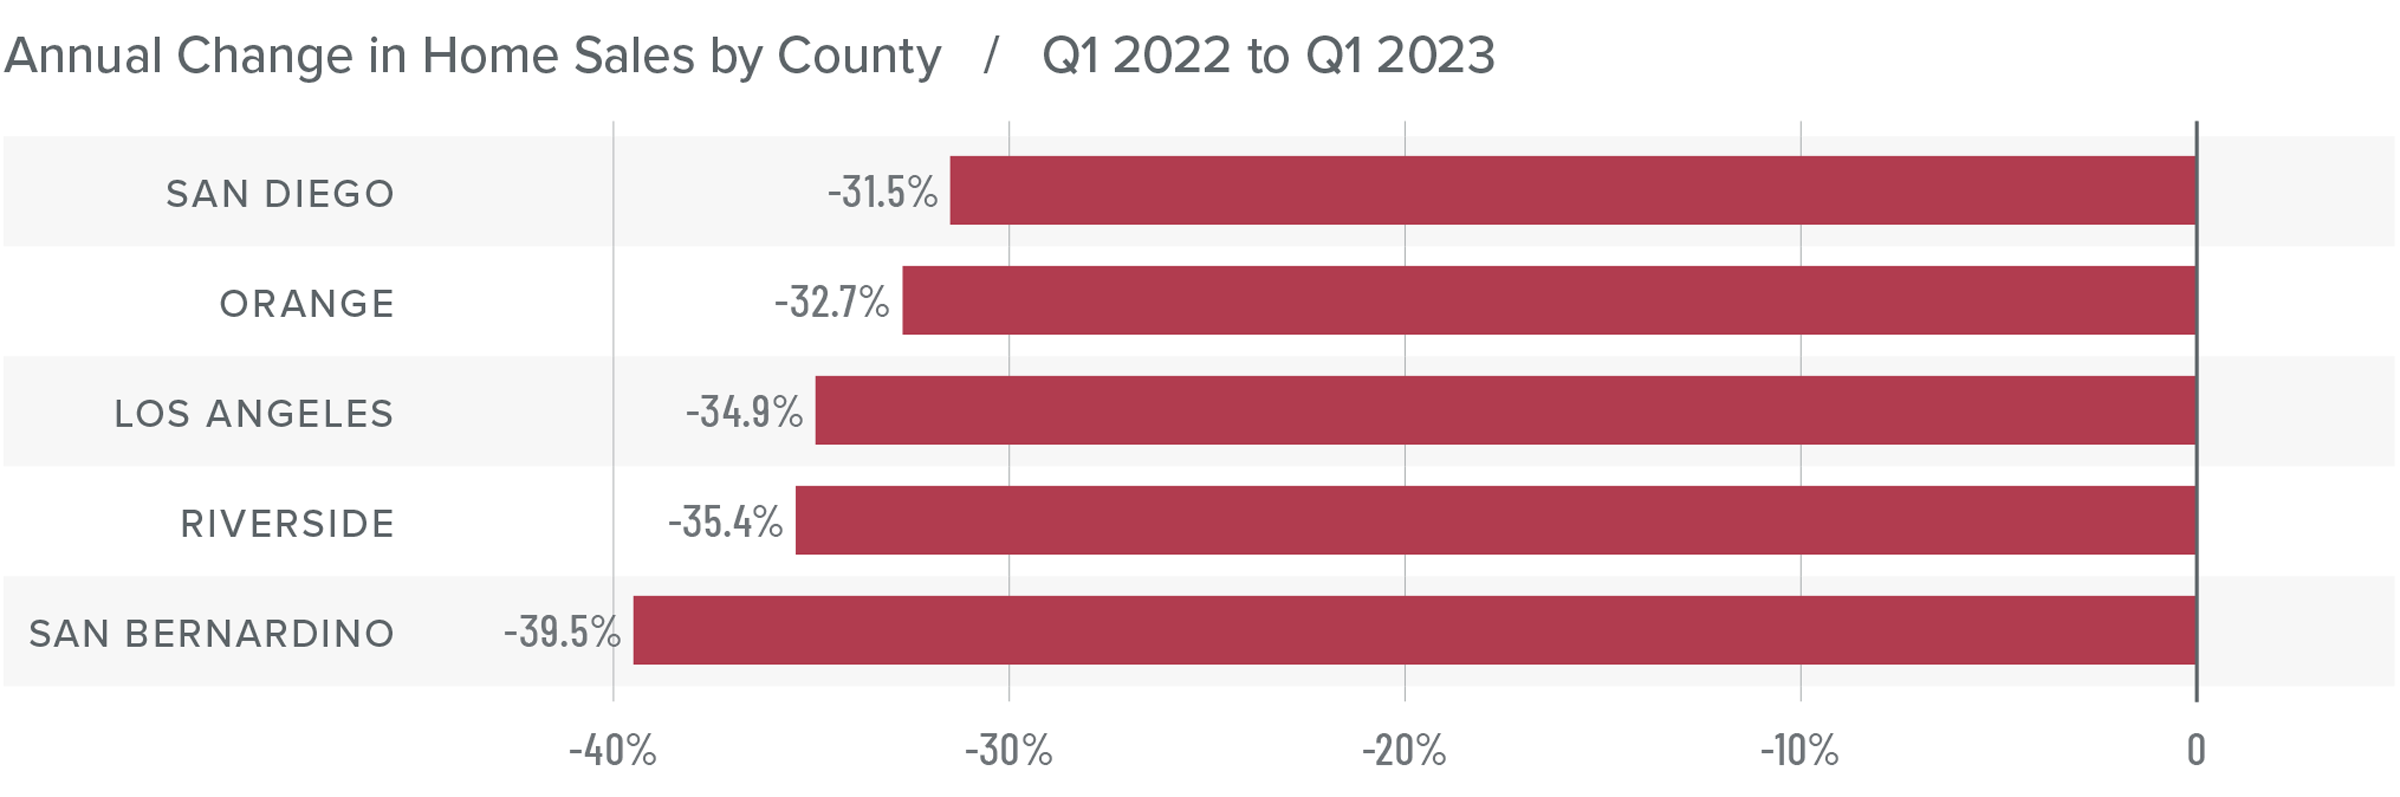
❱ In the first quarter of 2023, 27,577 homes sold, which is down 34.8% from the first quarter of 2022 and is 5.2% lower than in the final quarter of 2022.
❱ Pending home sales, which are an indicator of future closings, were 25.4% higher than in the fourth quarter, suggesting that sales activity in the second quarter of this year may pick up.
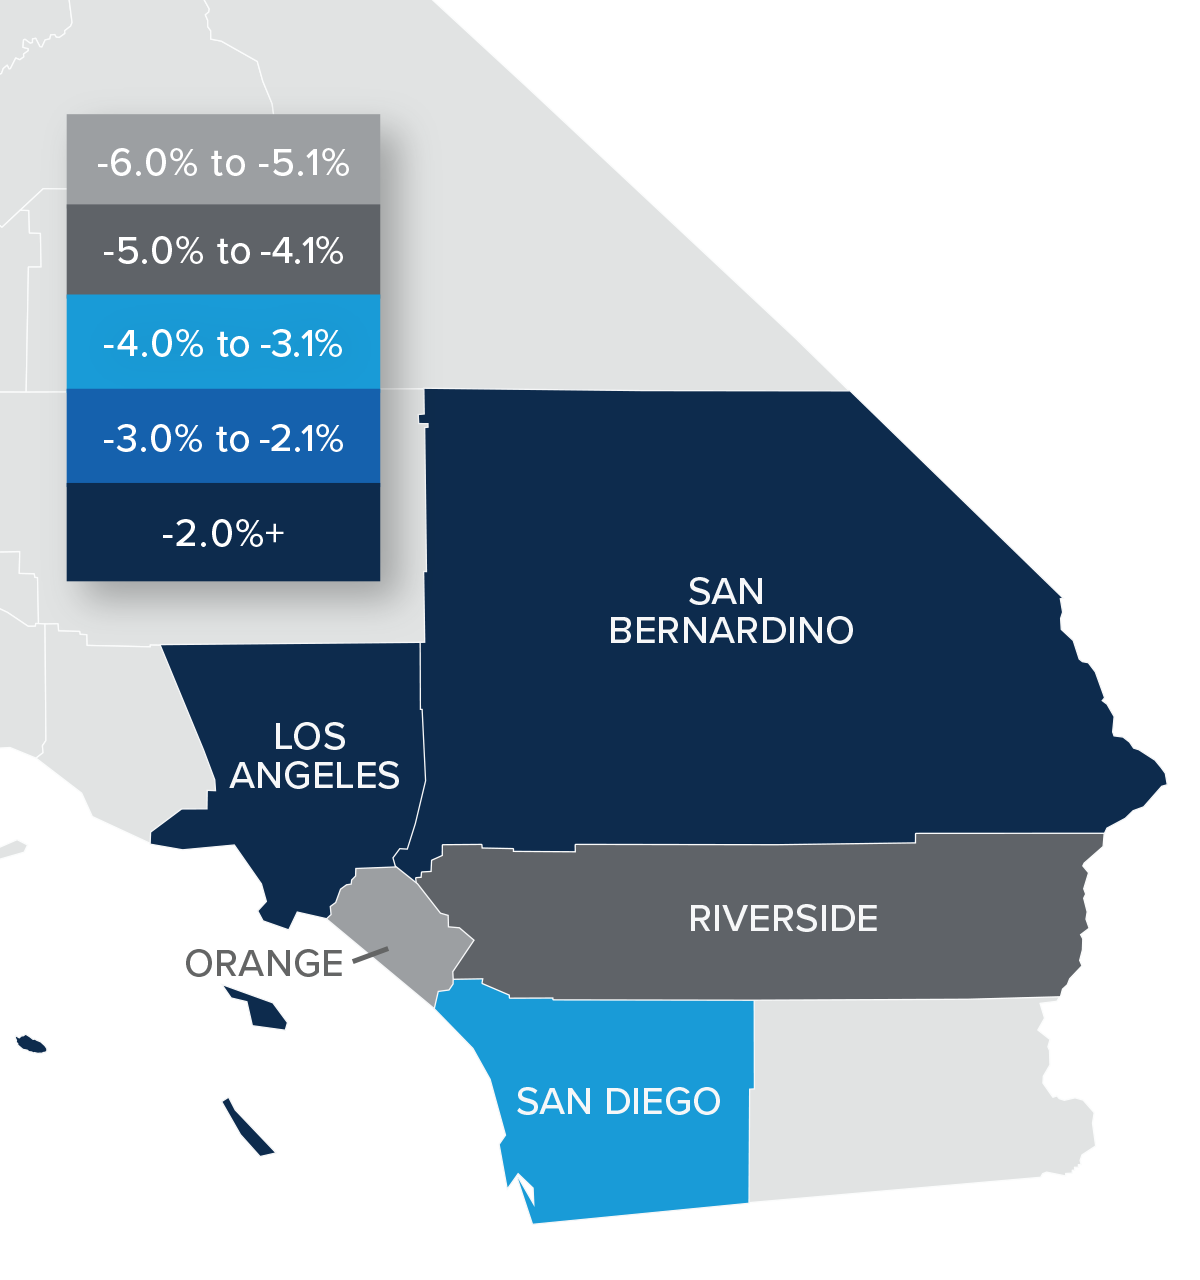
❱ On a percentage basis, sales fell the most in San Bernardino County, but all markets pulled back significantly. Compared to the fourth quarter, sales were higher in Riverside County (+7.1%) but fell across the balance of the market.
❱ The drop in sales can mainly be attributed to a lack of inventory: the number of homes for sale was down 27.6% from the final quarter of 2022. Additionally, mortgage rates rose by more than a full percentage point in February, which likely also impacted sales.
Southern California Home Prices
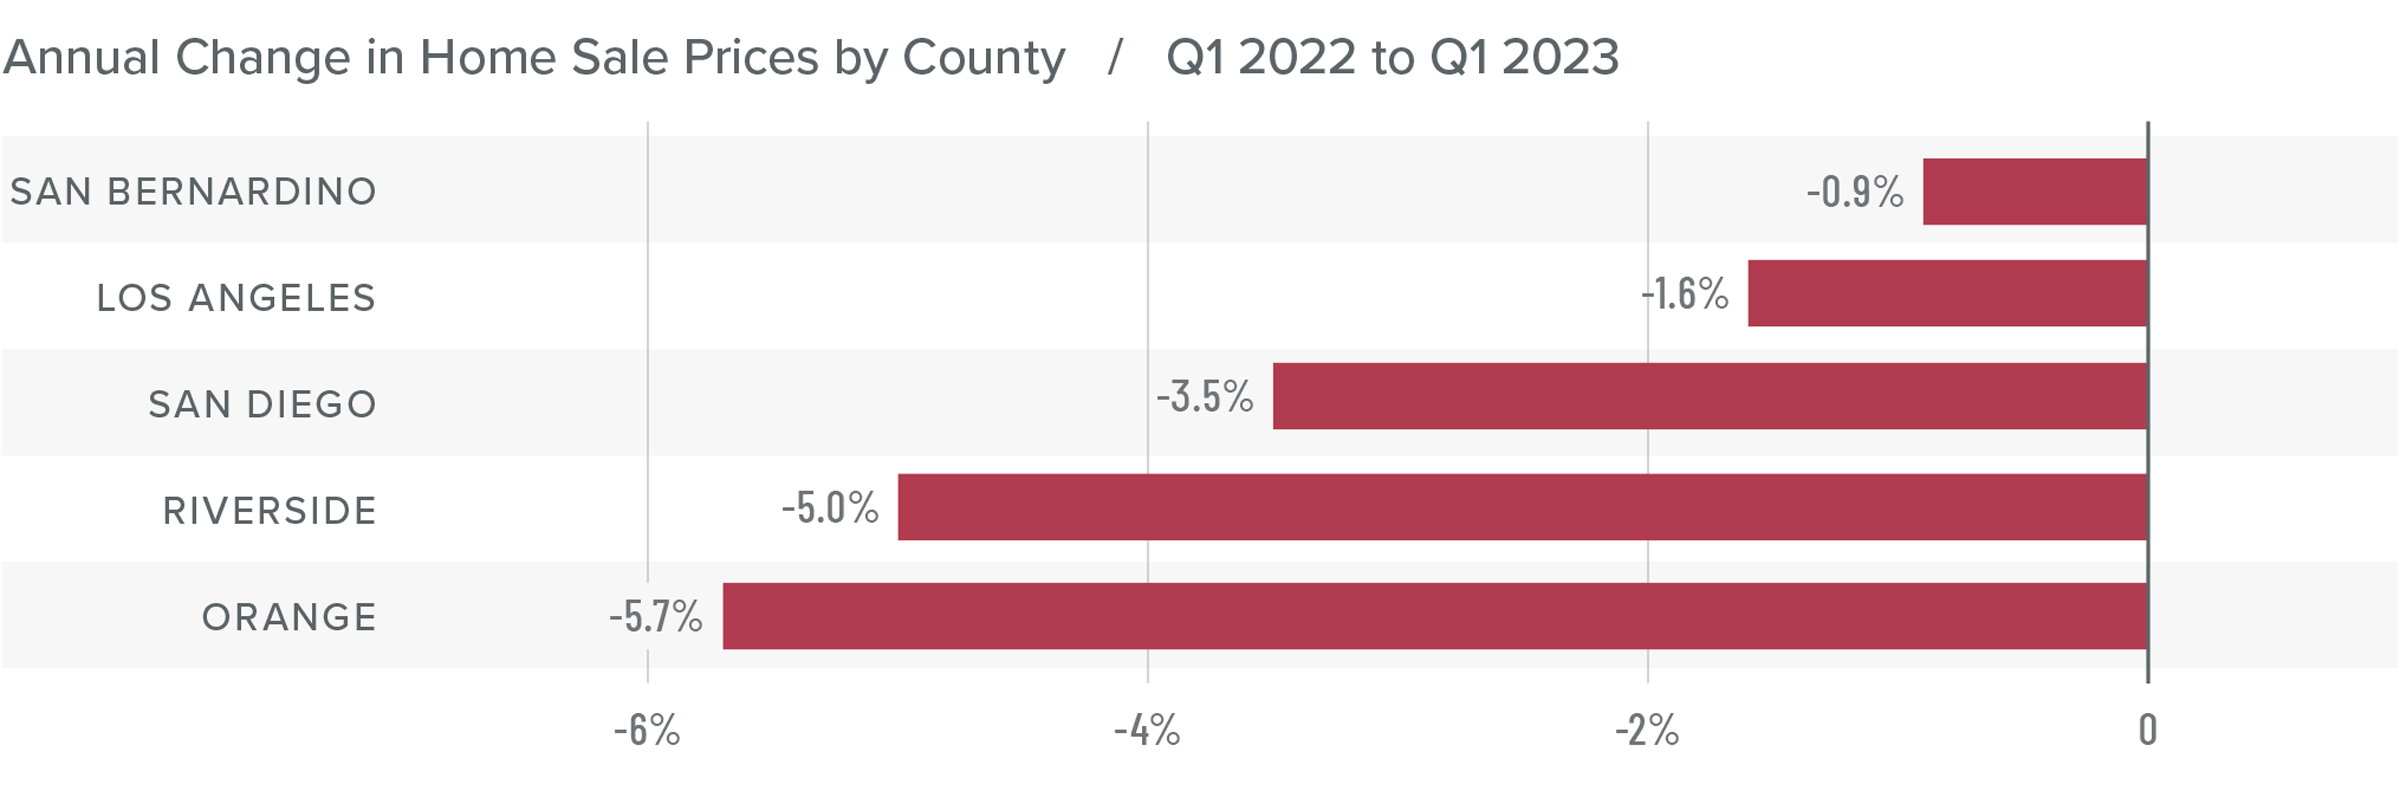
❱ Compared to the same period last year, home prices fell 2.5%. However, prices were 1.9% higher than in the fourth quarter of 2022.
❱ Affordability remains a significant issue, which has been exacerbated by elevated financing costs. That said, median listing prices in the quarter are up in every market other than San Bernardino, which suggests that home sellers may be starting to think that the worst of the price correction is behind them.
❱ Year over year, prices fell across the region but rose in all markets compared to the final quarter of 2022. Of note is that price growth was very solid in San Diego, Riverside, and Orange counties.
❱ While I expect mortgage rates to start stabilizing as we move toward summer, I think there will be some additional downward pressure on home prices. That said, things should start to turn around again in the second half of the year with a return to rising home prices.
Mortgage Rates
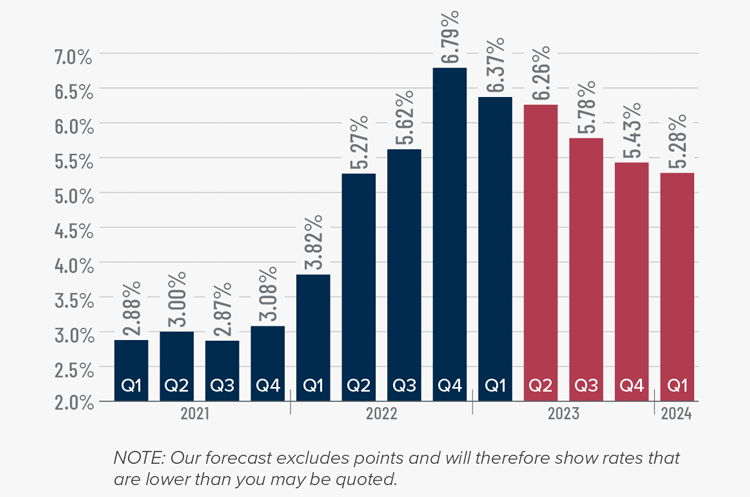
Rates in the first quarter of 2023 were far less volatile than last year, even with the brief but significant impact of early March’s banking crisis. It appears that buyers are jumping in when rates dip, which was the case in mid-January and again in early February.
Even with the March Consumer Price Index report showing inflation slowing, I still expect the Federal Reserve to raise short-term rates one more time following their May meeting before pausing rate increases. This should be the catalyst that allows mortgage rates to start trending lower at a more consistent pace than we have seen so far this year. My current forecast is that rates will continue to move lower with occasional spikes, and that they will hold below 6% in the second half of this year.
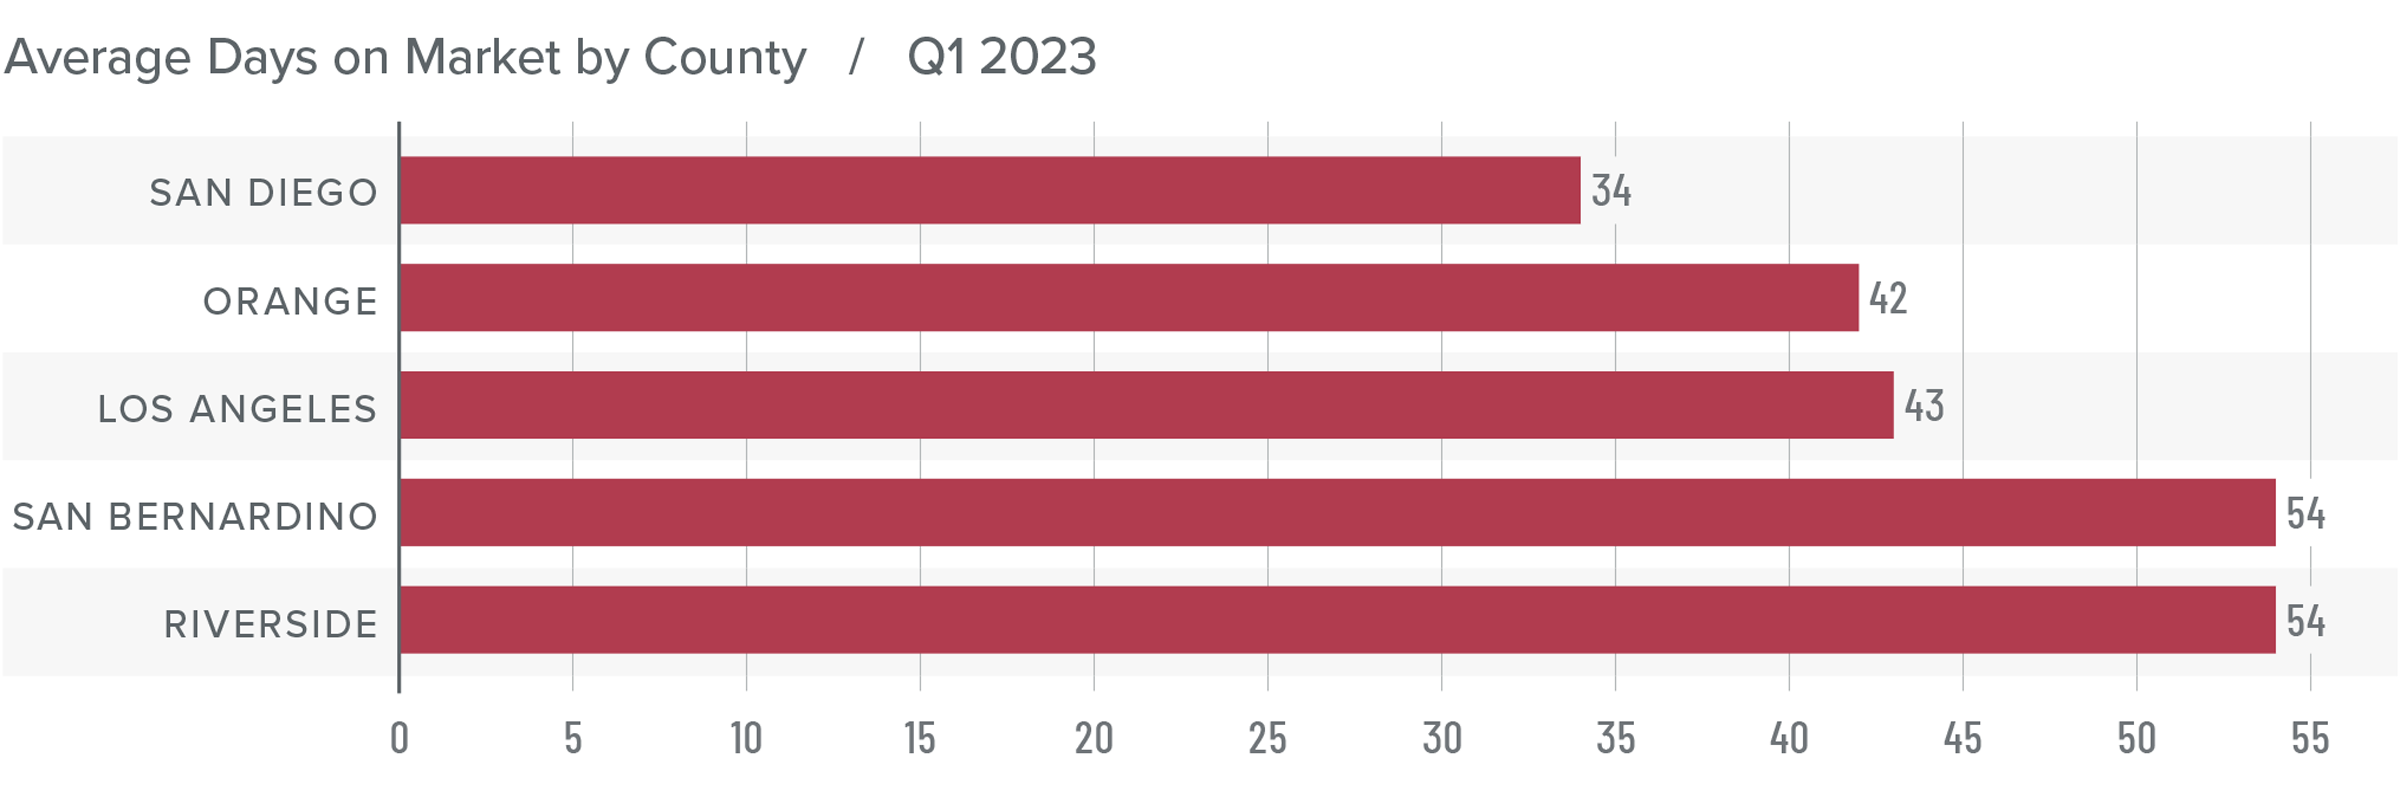
Southern California Days on Market
❱ In the first quarter of 2023, the average time it took to sell a home in the region was 45 days, which is 24 more than in the first quarter of 2022 and 9 more days than in the fourth quarter of last year.
❱ Market time also rose in all counties covered by this report compared to the fourth quarter of 2022.
❱ Homes in San Diego County continue to sell at a faster rate than other markets in the region, but all counties saw market time increase from a year ago.
❱ Higher mortgage rates and lower affordability still have some buyers sidelined. I expect to see increased activity once buyers become confident that mortgage rates have stabilized and that housing values have found a bottom.
Conclusions
This speedometer reflects the state of the region’s real estate market using housing inventory, price gains, home sales, interest rates, and larger economic factors.
The Southern California housing market is still trying to find its footing. Mortgage rates are not only still at elevated levels, but they are also moving erratically depending on events in the broader economy (e.g. inflation, bank failures, etc.) Although sellers seem to be more confident, buyers are remaining cautious, which suggests that the market recovery will take more time.
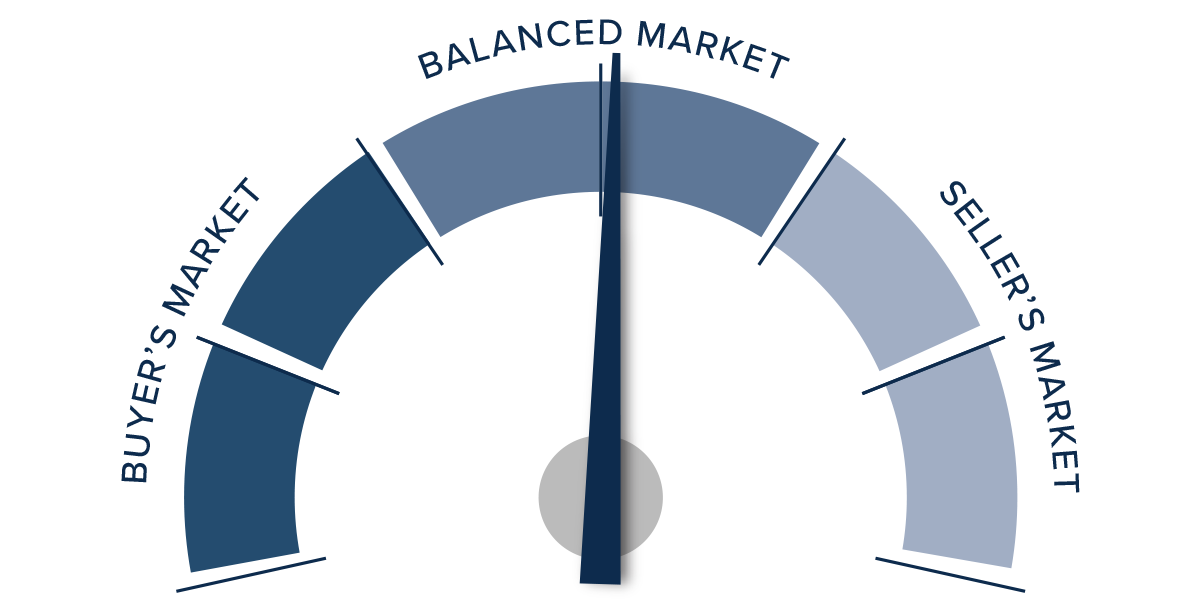
Lower inventory levels, higher pending sales, higher listing and sale prices, and an improving absorption rate all favor sellers. However, the market is not completely in their favor. As such, I have left the needle in the “balanced” section of the speedometer. I have tilted it slightly toward home sellers though as there continues to be strong demand for appropriately priced, well-located, and well-appointed homes.
About Matthew Gardner

As Chief Economist for Windermere Real Estate, Matthew Gardner is responsible for analyzing and interpreting economic data and its impact on the real estate market on both a local and national level. Matthew has over 30 years of professional experience both in the U.S. and U.K.
In addition to his day-to-day responsibilities, Matthew sits on the Washington State Governors Council of Economic Advisors; chairs the Board of Trustees at the Washington Center for Real Estate Research at the University of Washington; and is an Advisory Board Member at the Runstad Center for Real Estate Studies at the University of Washington where he also lectures in real estate economics.