
What is a Seller's Market?
When the housing market favors sellers, a seller can expect ideal conditions for selling their home. However, that’s not to say that a seller’s market doesn’t come with its own unique set of challenges for parties on both sides of the transaction. That’s why it’s critical for buyers and sellers to work with an agent who not only understands their wants and needs but who can also help them navigate highly competitive market conditions.
What is a Seller’s Market?
A seller’s market occurs when demand exceeds supply. When inventory is limited, competition amongst buyers is fierce. Median sales prices increase, days on market decrease, and homes commonly receive multiple offers, often over their original asking price.
Selling in a Seller’s Market
Though demand is high in a seller’s market, staging and making any necessary repairs are still important steps to take before hitting the market. An agent can help a seller make important decisions about which repairs and updates help add value to the home.
When it comes to offers and negotiations in a seller’s market, sellers have the leverage. It’s common for homes to fetch more than their asking price with multiple offers on the table. Though prices are being driven up by demand, a seller may choose to list their home at or just below fair market value with the hopes of starting a bidding war. Because competition is so high, buyers may be willing to waive an inspection contingency to help make their offer stand out. Agents can help sellers decide whether they should conduct a pre-listing inspection, which sometimes helps the seller get more offers and command a higher price.
With multiple offers on the table, it may be tempting to simply choose the one with the highest figure; however, the best offer is also the one that removes risk and aligns with the seller’s goals. Whether that entails waived contingencies, a shorter closing window, or an all-cash offer, in a seller’s market, the seller has the power to choose. Sellers should fully review each offer with the help of their agent before proceeding.
Buying in a Seller’s Market
Buyers in a seller’s market must act fast. Due to the high level of competition, they must be prepared for a frustrating scenario where their offers may not win out. This emphasizes the importance of working with a buyer’s agent. In a seller’s market, it’s more likely that the buying process will include such factors as seller review dates and escalation clauses. A buyer’s agent will help navigate these challenges while working with their client to make their offer stand out. They will formulate a strategy, comparing their client’s wish list and budget against the limited number of homes available and proceeding accordingly. A buyer’s agent will also set the expectation that, due to the competitive nature of the market, finding the right home may take longer than expected.
In a seller’s market, the buyer is at a disadvantage when it comes to negotiations. The chance of getting a contingent offer is minimal and pushing for certain closing dates and specific repairs may do more harm than good to their offer. A cash offer has significant power in a seller’s market. If a buyer can make a cash-heavy or even all-cash offer, it is likely to stand out to the seller. It gives the buyer more buying power and greatly increases their chances of winning a bidding war.
For more information on the conditions of your local market, visit our website for Quarterly Real Estate Market Updates from our Chief Economist, Matthew Gardner. For assistance planning a home sale or purchase, connect with a Windermere Real Estate agent here: Connect With an Agent

Knowing When to Sell Your Home
Of all the components involved in a successful home sale, there is perhaps no greater contributing factor than timing. Knowing when to sell your house gives you the best chance to make an impact when you hit the market. Every seller’s situation is unique but choosing when to sell comes down to how prepared you are, finding the right agent, and local market conditions. Once you’ve got a grasp of these elements, then you can decide if it’s the right time to sell.
Are You Ready to Sell?
Before you sell your home, your finances must be in order. Equity is a natural starting point for assessing your financial health. To calculate your equity, you’ll need to know your home’s market value. Your real estate agent can help you determine this by conducting a comparative market analysis (CMA), which involves comparing your home to others in your area by such characteristics as square footage, the number of bedrooms/bathrooms, age, and lot size. Once you know your home’s market value, subtract your current mortgage balance from that number and you’ll have your current home equity. If your equity is negative, then it may not be the best time to sell.
Beyond your home equity, there are plenty of other financial factors to consider when preparing to sell. Selling a home does not come without its own set of costs. Commission fees, home repairs, inspections, and staging are just some of the expenses you can expect to incur. For more information on the costs involved with selling your home, talk to your Windermere agent.
Selling a home is an emotional process that comes with significant lifestyle changes, so it’s important to make sure it’s the right time for you and everyone in your household. Part of a real estate agent’s’ role is understanding how the varying emotions of the selling process apply to different people. For every fear, worry, and hesitancy you may experience when trying to decide if it’s the right time to sell, your agent can share similar experiences while working with past clients.
Local Market Conditions
The state of the real estate market in your area could dictate whether it’s the right time to sell. Various factors affect local market conditions like inventory, seasonality, mortgage rates, and home price growth. Talk to your real estate agent about what the local conditions mean for your selling strategy and what kind of buyer negotiations you can expect to encounter. Agents have the tools and know-how to perform a complete analysis of the market to help you decide when the right time is to sell.
Find the Right Agent
Real estate agents are the catalyst for a successful home sale. They not only bring a wealth of resources to the table, but they can also offer helpful advice on the optimal time to sell. Agents can assess your goals for selling your home, how that aligns with your budget, and how those factors fit into the context of current local market conditions.
To truly know whether it’s the right time to sell, it’s important to find the right agent who understands the needs of your household. The more an agent knows about your situation, the better they can formulate a selling strategy. This also allows them to understand what the best offer for your home looks like. When searching for an agent, ask for referrals from your inner circle. Interview multiple agents to get an idea of their qualities, and select the one that makes the most sense for you.
When you’re ready to sell, or if you have any questions about the selling process, talk to an experienced Windermere agent here: Connect with an Agent

Timeless Home Design
When decorating and designing, homeowners often strive for a home that may incorporate vintage and modern elements but remains timeless at its core. Fortunately, certain design principles and elements have stood the test the time and can help you curate the home you desire. Here is your guide to understanding how you can design a home that looks and feels timeless.
Principles of Timeless Home Design
Balance
When designing a space in your home, balance is a key concept to delivering a timeless ambiance. Achieved through a proportionate arrangement of objects and colors, balance will help create a logical pattern in your home that pleases the eye. Experiment with symmetry in your home to build balance. This doesn’t mean that there needs to be two of every object, rather in every space you should utilize the objects and color schemes present to create symmetry.
Focal Point
Imagine a living room without a couch or mantle, or a dining room without a dining table. These images are confusing because we simply don’t know where to focus our attention. A core principle of timeless design is that space should have a focal point to give order to the room. Focal points don’t always have to be derived from a built-in feature of the home, you can create one with furniture, artwork, or some other form of eye-catching décor.
Scale and Proportion
Scale and proportion are two fundamental concepts of interior design and are key to creating a timeless décor. Simply put, proportion refers to the relationship of items and colors, while scale refers to their relationship with the room. For example, if a room in your home has high ceilings, this allows for taller furniture and artwork, while the most spacious rooms in your house are the best home for large décor pieces and furnishings. Proper usage of scale and proportion also means leaving some space between items to let the room breathe, so to speak.
Colors and Patterns
For a timeless look and feel, choose more classic color and pattern schemes. Basketweave is a traditional pattern that helps to create symmetry. Stripes are always in style and can help to reinforce clean lines. Stick to neutral paint colors on your walls as they give you the flexibility to add décor without overwhelming the room. Combinations of off-whites, beiges, grays, and earthy tones will deliver that timeless feel you’re looking for.
Natural Elements
There’s nothing more timeless than nature. Materials like wood, stone, and marble have been a cornerstone of design since antiquity. Whether you utilize these materials in your home as furniture, accent pieces, or focal points, they will help create a trend-free, organic environment in any room.

10 Predictions for the 2021 Housing Market by Windermere’s Chief Economist

1. Economic Growth Will Pick up – But Not Until the Summer
As you are all aware, the job recovery has slowed significantly over the past few months and the December number – which saw employment levels actually drop by 140,000 jobs – was really quite appalling.
But… as bad as the numbers were last month, I am still expecting to see solid employment gains this year.
That said, I don’t see significant improvement until the vaccine starts to be distributed widely AND a majority of us choose to take it.
And when we get to that point – likely in the second half of this year – look for a lot more jobs to be added across the country, but employment levels will rise for a reason that most people aren’t thinking about, and it’s because I believe that the public – as they feel more comfortable going out – will start
to spend again.
In fact, it’s my forecast that spending will rise very significantly later this year and that will give a much-needed boost to the economy and the job market.
You see, we haven’t been spending our hard-earned dollars at normal levels for almost a year now and, quite frankly, the cash that we have been hoarding since the pandemic started is starting to burn a hole in our pockets.
So, my number 1 prediction is that we will see significant economic growth– and job gains – this year, but that most of the growth will come in the second half of 2021
2. The Move to the Suburbs is Real – But Don’t Get Carried Away! Looking now at the housing market, there’s been a lot of talk about a COVID-19 induced flight away from cities and into the countryside.
Well, the numbers don’t lie – there have certainly been more interest from buyers looking at markets outside of our core metros and this – obviously – is a function of the work-from-home phenomenon that I believe is not a flash in the pan, rather it is real and will be in place for a long time, if not forever.
But there is a bit of a wrinkle in this theory. In as much as we are certainly seeing suburban flight from markets like New York and San Francisco, the same can’t be said for much of the rest of the country.
In fact, according to a study recently published by Lending Tree, the percentage of owners who moved out of the top 50 largest metro areas in the country in 2020 was just 2.2% – now this is up from 1.9% in 2019 – but it’s hardly the tsunami that many had anticipated. And it’s also worth mentioning that some of the markets within Windermere’s footprint actually saw a net increase of migrating homeowners and not a drop. Examples of this include Denver which saw the number of households moving in up by 3.6% in 2020; Portland was up by 3.4%; Seattle by 3.3%; and Sacramento saw an in-migration rise by 2.9%. Although some households will move because work from home allows them to relocate to cheaper markets, it doesn’t mean that we are all headed out to the wild blue yonder.
In fact, I believe that – even though a good number of households will move – many will stay within striking distance of their workplaces, and I say this because I expect the work from home concept to be one where we work part-time from our homes, and part-time at our offices.
My number 2 forecast is that although people will move away from some of our core cities this year, many will still stay in the same region as work from home will not be a full-time situation for a majority of workers.
3. Not all Apartment Markets are Created Equal
The apartment market has been hit very hard by COVID-19 with rising vacancy rates putting significant downward pressure on rents in many large markets such as Seattle, San Francisco, Boston, and New York but guess what? We are actually seeing rents still rising in many smaller cities and these include Boise, Fresno, and Tucson, Arizona.
And this move away from expensive apartment markets is occurring for several reasons not least of which is – again – work from home, but it’s also due to an increasing number of renters turning into home buyers, and it’s also because the rent premium for being “close to the action” in major cities has faded and, because of this, I see previously overlooked suburbs and
small metros benefitting from growing demand.
2021 will be a tough year for many landlords in larger cities not just for the reasons I have already mentioned, but also because we are bringing on over 400,000 new apartment units across the country this year and many new developments are in these larger cities.
Number three forecast – Apartment owners in pricy markets will continue to suffer in 2021, but smaller markets will perform rather well and – after many years of being overlooked – I am also forecasting those apartment developers will start to turn their attention toward suburban markets and away from many of these larger cities. We haven’t seen that in over a decade.
4. The Luxury Housing Market Will Continue to Perform Very Well
One of the sectors that really performed far better than anyone – including me – had anticipated in 2020 was the luxury housing market, and I expect this sector to be very robust again this year and the reason for this, primarily, will be interest rates. Jumbo mortgage rates, which saw a spike at the start of the pandemic, have since dropped significantly and this is benefitting buyers of luxury housing.
Buyers of luxury housing will be very active this year and I see many focusing on some secondary markets – for value reasons – but I still expect that the classic luxury markets, like the Hamptons for example, will also do very well.
Other markets where the luxury sector will outperform are Miami – but this will be mainly due to tax changes in New York City driving owners to relocate – and I’m also watching Southern California and predict that luxury homes down there will also outperform this year.
One more thing I would mention is that I also expect that, as the country starts to reopen post-COVID, we will see a rebound in foreign buyers as well so keep an eye on that too.
Forecast number 4 – the luxury market will be more robust in 2021 than many had anticipated.
5. Cities will Start to Pay More Attention to Zoning (at Long Last!)
Many of you will be more than aware of my ongoing concerns regarding housing affordability. Now, we have seen some cities like Minneapolis, and even some States – and here I’m talking about Oregon – start implementing significant zoning changes to allow for more new home development in their markets which is impressive, but it certainly isn’t happening everywhere.
However, I believe that this year we will – at long last – start to see more attention from legislators when it comes to increasing the supply of land for residential construction and many will do this by adjusting current zoning policies to allow more land on which to build.
So why this new focus? Well, their attention will be driven by worries that high housing costs in their own markets may lead businesses to start to look at cheaper areas and – possibly – move away from their current locations, and other businesses that are thinking about expanding into new markets – well, they will be increasingly thoughtful about how housing costs in expansion markets will impact how much they have to pay their new employees.
You see, we know that almost every jurisdiction across the country is suffering from significant shortfalls in revenue and, because of this, legislators will have to start focusing on attracting new businesses – and retaining as many businesses as possible – in order to help replenish their coffers.
Forecast Number 5 – Although it won’t happen overnight, I am hopeful that discussions around zoning changes will start to pick up some steam this year.
6. Adaptive Reuse Will Gain More Traction
Over the past several months, many of you have asked me whether we will see office buildings converted to residential uses as there will be fewer workers occupying offices. Well, I am sticking to my belief that the cost of conversion and the layout of office buildings (primarily due to core depths, lack of plumbing penetration, and the like) just don’t lend themselves to conversion to residential uses – well, that is unless you buy them at bankruptcy prices!
That said, I am expecting to see other building types that may be better suited for conversion into either single residential use or a mix of uses, start to become attractive to developers.
And what are these other product types, you ask? Well, likely unsurprising to you is that I am looking at hotels – which are going to continue to be hard hit for, in my opinion, years… and retail malls – both strip as well as regional.
You see, we are already seeing more hotels – mainly inns and motels – be listed for sale as they are just not providing adequate cash flow and I expect
that some, but not all, may become ripe for conversion into residential uses.
As far as malls are concerned, look for more interest in the conversion of regional malls into mixed-use projects, but strip malls may get rezoned into single residential uses.
Number 6 – developers will start to pay more attention to the reuse of existing buildings in addition to ground-up construction.
7. What’s important in a post-COVID-19 home?
The pandemic has started to change what we are looking for in a home and it’s actually very interesting to see what is now becoming important to buyers. We know that work from home is real, but I see households moving not just because housing is relatively cheap further out, but many will look at their own homes – even if they are on the fence about moving – and realize that it’s just not set up for working remotely on a semi-permanent, or permanent, basis.
How many people do you know who have spent the past several months working from their dining room tables? I’m one!
But I also expect to see sellers who may not have an office in their homes, create dedicated spaces for an office set up to attract buyers or, where they just can’t do that, they will, at a minimum, create a dedicated Zoom space before listing their homes for sale!
I am also forecasting that you will also see new construction housing reflect these changes with builders better aligning their product with new consumer preferences and that demand for new homes will rise in 2021 as builders address these new requirements from buyers.
People want more space today because they are using their homes more and I already see builders addressing this with the average new home size rising last year following several years where new homes were actually getting smaller.
Also, when it comes to new construction, open floor plans — once a must — well they will be replaced too thanks to COVID-19 and buyers wanting more room separation.
And finally, I expect buyers who are looking to move a lot further out to become far more interested in markets that have high-speed internet access. Many of us take it for granted, but buyers will start to list this as a requirement, rather than an option – again possibly limiting moves too far out into the country.
Forecast Number 7 – Home preferences are changing – builders are already adapting, and owners of existing homes will have to do what they can to meet these new requirements.
8. Worries About Forbearance are Overblown.
Since last spring, a question that I have fielded probably more than any other, has revolved around the topic of forbearance.
The GSE’s have extended the forbearance program to the end of March so some of the pressure has been removed, but there are a lot of people who fear that – when forbearance expires – we will see a veritable tsunami of foreclosed homes come online and this massive increase in supply will lead to all homes seeing values drop.
Well, it won’t happen, and here’s why.
First off, the number of homes in forbearance is already down by 43% from its May peak. Even though it is true that the pace of the drop in the number of homes in the program has slowed, the trend is still headed in the right direction.
Yes, there are still 2.7 million homes in the program, but I believe that, as owners start to get back to work again, many will be able to either refinance their loans or work with their lenders to extend the term of their mortgages in order to make up missed payments and most will not end up in foreclosure.
I would also add many owners in the program – if they just can’t get back on track – will sell in order to keep the equity that they have built over the last few years and, in most areas, there will be enough buyer demand and they will be able to get out from under forbearance by selling and paying off the mortgage and missed payments that way.
Of course, we will see foreclosures rise this year, but I just don’t see the majority of owners in forbearance be forced into foreclosure and that will limit the downside risk to the housing market.
That said, I am a little more worried by condominium owners who are in forbearance as the supply of these homes is already on the rise and this is causing prices to soften relative to single-family homes.
This is not a phenomenon spread broadly across the country, but many markets are seeing condo price growth slow and some – here I am looking specifically at Queens in New York, Suffolk County in Boston, and in San Francisco County – are seeing real price declines and I do expect to see a greater share of condos end up in foreclosure, but a far smaller share of single-family housing will suffer the same fate.
And I must add that not all market areas are created equal. Today, total delinquency rates are very high in states like Mississippi, Louisiana, New York & Oklahoma, but here in the western US they are significantly lower.
Interestingly, when I looked at Windermere’s footprint, I am delighted to report that the States with the lowest rate of non-performing mortgage include Idaho, here in Washington State, Colorado, Oregon, and Montana.
So forecast number 8 – I do not anticipate a wave of foreclosures following the end of forbearance, and that the foreclosures that do occur will have a limited impact on the broader ownership housing market.
9. Mortgage Rates Will Rise – But Don’t Worry
Rates for 30-year conforming mortgages have broken below all-time lows 16 times since the pandemic started. Really remarkable with the average 30-year rate at the time of recording this video standing at 2.65% and rates down by over a full percentage point over the past year and that, naturally, has allowed prices to continue rising at above-average rates, but going forward I just don’t see them dropping much more, and I believe that we have, at least for now, reached a floor when it comes to rates.
Without getting too academic, the reason I say this is that mortgage rates track the interest rate on 10-year treasuries – or at least they should – but that relationship broke back in February – because of the pandemic. However, treasury yields have started to rise again, and that relationship is now back in line which tells me that rates are unlikely to drop much further – all things being equal.
Prediction number 9 – mortgage rates are unlikely to drop much more, but don’t anticipate them rising too much with this year averaging around 3.1%. Still very competitive.
10. US Home Sales Will Rise Significantly, but Price Growth Will Moderate
Finally, I just have to talk about home sales and prices even if I did cover this in my last forecast. Given all the factors I have already talked already, we will see more demand from buyers this year, and I also expect to see listings actually increase as people look to relocate, and this will lead sales in 2021 to rise to a level we haven’t seen since 2006!
And big players in the housing market as far as buyers are concerned will be renters turning into home buyers and I would add that we could see first-time buyers make up an even bigger share of the market if the Biden Administrations goal to introduce a new first-time buyer tax credit gets enacted – but that is certainly not a given.
Overall, existing home sales will rise by 7.7% in 2021 to around 6.2 million units.
As for prices, well I see them increasing again this year but, as I just mentioned, mortgage rates will start to move modestly higher and this will be a bit of a headwind to price growth, and affordability constraints will also start to slow appreciation in expensive housing markets. This year I am looking for average prices to rise by a relatively modest 4.1%.
My final forecast – home sales will rise significantly this year, but price growth will moderate.
For a more in-depth Economic Forecast in the Inland Empire, register for our FREE upcoming event, live with Matthew Gardner:


Q4 2020 Southern California Real Estate Market Update

The following analysis of the Southern California real estate market is provided by Windermere Real Estate Chief Economist Matthew Gardner. We hope that this information may assist you with making better-informed real estate decisions. For further information about the housing market in your area, please don’t hesitate to contact your Windermere agent.
REGIONAL ECONOMIC OVERVIEW
Last summer’s recovery in the regional employment market that followed losses due to COVID-19 has tapered off because of the rapid increase in new infections. Although the region has recovered 1.25 million of the jobs that were lost, total employment is still down 763,000 jobs from the peak last February. With the slowdown in job growth and additional job losses in November, the current unemployment rate is 8.8%. For perspective, this is down from 12.3% at the end of the third quarter, but still significantly higher than the 4% rate last February.
The latest data available (for November) showed the lowest unemployment rates were in Orange County (6.4%) and San Diego County (6.6%). The highest rate was, unsurprisingly, in Los Angeles County, where it was 10.6%. I suggested in the third quarter Gardner Report that the pace of job growth was going to slow, and that proved accurate. Though I expect to see jobs return this year, most of the improvement will occur in the second half of the year when, hopefully, a vaccine is freely available.
SOUTHERN CALIFORNIA HOME SALES
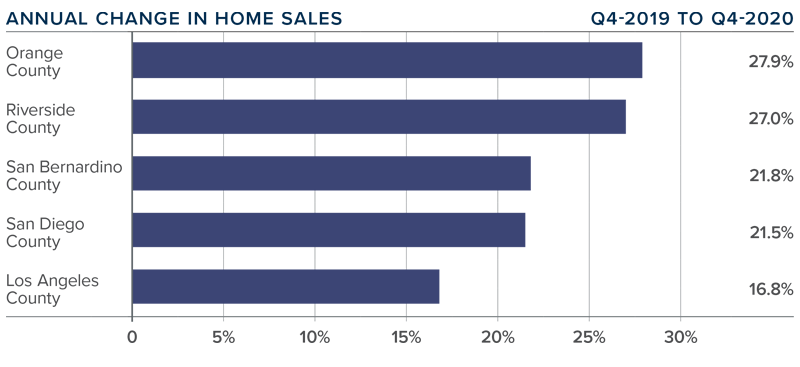
❱ Regardless of the slow economic recovery, the housing market continues to perform well, with 50,114 homes selling in the final quarter of 2020. This is an increase of 21.9% year-over-year.
❱ Pending home sales (an indicator of future closings) were 21.3% lower than in the third quarter, but I attribute this to seasonality and inventory constraints.
❱ Fourth quarter sales rose significantly in all counties relative to a year ago, with very impressive gains in Orange and Riverside counties. That said, all markets saw the number of home sales increase by double digits.
❱ There was an average of only 19,203 homes for sale in the final quarter of the year. This is 35% lower than a year ago and 17.3% lower than in the third quarter of the year.
SOUTHERN CALIFORNIA HOME PRICES
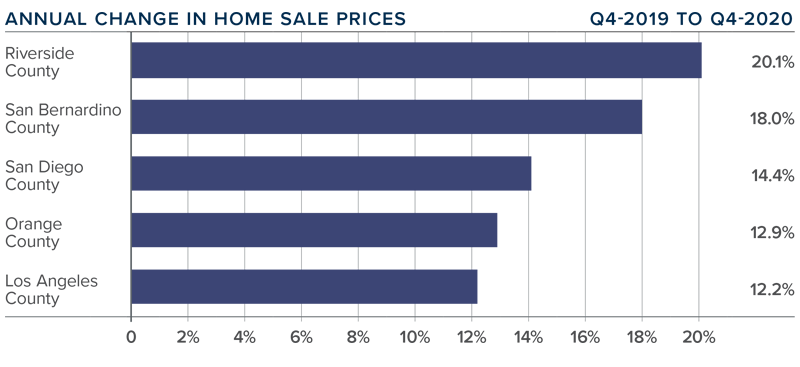
❱ Year-over-year, the average home price in the region was $831,880. This was 13.4% higher than a year ago and 2.4% higher than in the third quarter of 2020.
❱ Mortgage rates have remained at historic lows, which has allowed prices to rise at well-above-average rates. Given that home prices have been rising at a far faster pace than incomes, affordability concerns continue to grow.
❱ The region saw double-digit price growth across all counties contained in this report, with further significant increases in the relatively affordable Riverside County.
❱ Mortgage rates appear to have reached a floor and are unlikely to drop much further. Given that I do not expect to see significant income growth this year, it is likely that the pace of home-price appreciation will start to slow.
DAYS ON MARKET
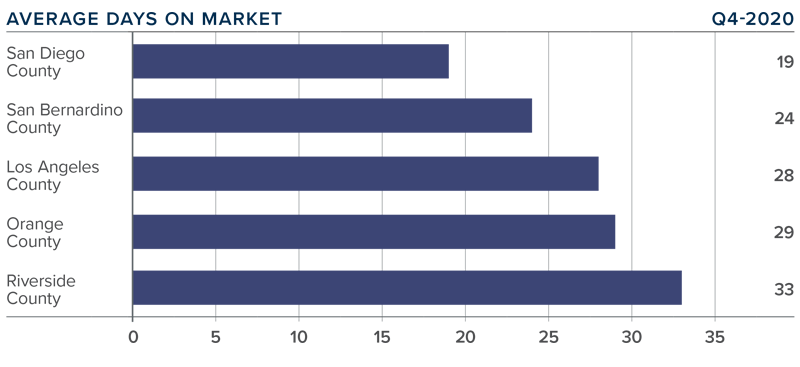
❱ In the final quarter of the year, the average time it took to sell a home in the region was 27 days, which is 19 fewer days than a year ago, and 6 fewer than in the third quarter of 2020.
❱ All markets contained in this report saw the time it took to sell a home drop compared to the fourth quarter of 2019.
❱ Homes in San Diego County continue to sell at a faster rate than other markets in the region. In the fourth quarter, it took an average of only 19 days to sell a home there. This is 12 fewer days than it took a year ago.
❱ The decline in market time is due to limited inventory levels and significant demand.
CONCLUSIONS

This speedometer reflects the state of the region’s real estate market using housing inventory, price gains, home sales, interest rates, and larger economic factors.
Home sales and prices are significantly higher, and demand for housing is very much in place. Naturally, this favors home sellers who are still in control of the market. I do expect to see some improvement in listing activity this year, which, in concert with modestly rising interest rates, will likely start to take some of the steam out of the market. However, any moderation in the market has yet to appear.
Even given the possible headwinds mentioned above, I am moving the needle a little more in favor of sellers as solid demand is still in place.
ABOUT MATTHEW GARDNER

As Chief Economist for Windermere Real Estate, Matthew Gardner is responsible for analyzing and interpreting economic data and its impact on the real estate market on both a local and national level. Matthew has over 30 years of professional experience both in the U.S. and U.K.
In addition to his day-to-day responsibilities, Matthew sits on the Washington State Governors Council of Economic Advisors; chairs the Board of Trustees at the Washington Center for Real Estate Research at the University of Washington; and is an Advisory Board Member at the Runstad Center for Real Estate Studies at the University of Washington where he also lectures in real estate economics.

Windermere Living Magazine - Winter 2020
Windermere Living Winter Edition Now Available!
The latest issue of Windermere Living is now available. Check out your featured listings and cozy culinary creations, tips for a museum inspired gallery wall, how to shop for your home virtually, and more!

Q4 Southern California Real Estate Market Update | Gardner Report
The following analysis of the Southern California real estate market is provided by Windermere Real Estate Chief Economist Matthew Gardner. We hope that this information may assist you with making better-informed real estate decisions. For further information about the housing market in your area, please don’t hesitate to contact me.
ECONOMIC OVERVIEW
The counties covered by this report — Los Angeles, San Diego, San Bernardino, Orange, and Riverside — saw total employment rise 54,500 jobs (+0.5%) year-over-year, an improvement compared to employment growth in the third quarter of 2019. Job growth rose in all but Orange County, which saw a contraction of 8,900 jobs.
The region’s unemployment rate dropped from 3.9% to 3.6% over the past year, with the total number of unemployed persons down 25,900 persons year-over-year. In all, these are reasonable numbers, though employment growth in this region remains lower than in other West Coast states.
HOME SALES
- There were 43,915 homes sold in the final quarter of 2019. This was an impressive increase of 10.7% over the same period in 2018, but 10.8% lower than in the third quarter of the year (likely a function of seasonality).
- Pending home sales (an indicator of future closings) rose 18.4% compared to a year ago but dropped 17.1% from the third quarter of 2019.
- Fourth quarter home sales rose in all counties contained in this report. Of note was a significant increase in Orange County, where over 1,000 more units changed hands than in the final quarter of 2018.
- There was an average of 31,380 active listings in the fourth quarter — down 23.3% from a year ago and 20% lower than in the third quarter of the year. The market is tighter than I would like, but there is clearly demand from buyers.

HOME PRICES

- Year-over-year, home prices in the region were 4.6% higher. They were 1.3% higher than in the third quarter of 2019.
- Affordability concerns persist but buyers in the region still seem able to pay more for housing. That said, I maintain my position that price growth will continue to slow—though remain positive—as we move through 2020.
- Home prices were higher in all counties contained in this report, with San Bernardino County holding onto the number one spot for price growth (+8.2%). Los Angeles and Riverside counties also saw significant price gains.
- In 2020, I expect home prices will rise and mortgage rates should remain below 4%.

DAYS ON MARKET
- The average time it took to sell a home in the region was 45 days, which is 1 day fewer than a year ago, but 3 days more than the third quarter.
- Two markets — San Diego and Riverside — saw the time it took to sell a house drop compared to the final quarter of 2018.
- Homes in San Diego County continue to sell at a faster rate than other markets in the region. In the final quarter of 2019, it took an average of 32 days to sell a home. This is 3 fewer days than it took a year ago.
- Market time dropped compared to a year ago, and I think we may see further contraction as we move into the more buoyant spring sales period.

CONCLUSIONS
 The speedometer reflects the state of the region’s real estate market using housing inventory, price gains, home sales, interest rates, and larger economic factors. Inventory levels and affordability concerns persist, but there still appears to be demand from home buyers. Pending sales have risen, which suggests the market still has legs to grow, thanks in no small part to competitive mortgage rates. Given the tight inventory levels and decent demand, I have moved the needle a little more toward sellers.
ABOUT MATTHEW GARDNER
As Chief Economist for Windermere Real Estate, Matthew Gardner is responsible for analyzing and interpreting economic data and its impact on the real estate market on both a local and national level. Matthew has over 30 years of professional experience both in the U.S. and U.K.
In addition to his day-to-day responsibilities, Matthew sits on the Washington State Governors Council of Economic Advisors; chairs the Board of Trustees at the Washington Center for Real Estate Research at the University of Washington; and is an Advisory Board Member at the Runstad Center for Real Estate Studies at the University of Washington where he also lectures in real estate economics.

![]()

Q2 Southern California Real Estate Market Update | Gardner Report
The following analysis of the Southern California real estate market is provided by Windermere Real Estate Chief Economist Matthew Gardner. We hope that this information may assist you with making better-informed real estate decisions. For further information about the housing market in your area, please don’t hesitate to contact your Windermere agent.
ECONOMIC OVERVIEW
Unexpectantly, the counties covered by this report — Los Angeles, San Diego, San Bernardino, Orange, and Riverside — saw total employment drop by 10,700 jobs (-0.1%) year-over-year. However, while Los Angeles and Orange counties reported declines, the smaller Riverside, San Bernardino, and San Diego counties saw employment rise. This is a significant reversal from the growth rates that have been in place for quite some time and may be due to re-benchmarking, which is when the government compares its sample to broader, historic data. I suspect that this is an anomaly and will reverse course, but I will continue to follow employment data closely as we move through the balance of the summer to see if this is a trend.
Over the past year, the unemployment rate in Southern California dropped from 3.6% to 3.4%, which further points to a data issue rather than a new trend that we need to be concerned about. I’ll know more when we publish the third quarter Gardner Report.
HOME SALES
- There were 49,996 home sales in the second quarter of 2019. This was a drop of 3.6% from the same period in 2018 but 46.4% higher than the first quarter of this year.
- Pending home sales (an indicator of future closings) rose by 3.7% compared to a year ago, suggesting that total sales in the third quarter are likely to be an improvement over current levels.
- Following a trend that started last fall, home sales fell across the board. The most noticeable decline was again in San Bernardino County, which fell by 6.7%. The smallest drop was in the relatively affordable Riverside County.
- There was an average of 40,174 active listings in the second quarter — up 13.1% from a year ago and 6.7% higher than in the first quarter of the year.

HOME PRICES
- Year-over-year, average prices in the region were flat but were 5.3% higher than in the first quarter of 2019.
- As stated above, affordability issues continue in most Southern California markets and this will likely lead price growth to taper.
- Price growth in second quarter was mixed. Riverside County continues to have the greatest annual appreciation (+4.1%). Price gains were also seen in San Bernardino and San Diego counties. There were modest drops in average sale prices in Los Angeles and Orange counties, but this is not of great concern at the present time. That said, it is clear that affordability issues are present in these markets.
- On a year-over-year basis, I still expect to see home prices continue to rise, but this likely only due to the very competitive mortgage rates. If rates move higher, this will have an impact on price growth.


DAYS ON MARKET
- The average time it took to sell a home in the region was 44 days. This is an 8-day increase over the second quarter of 2018 but is down 9 days compared to the first quarter of 2019.
- All markets saw the time it took to sell a house increase compared to the second quarter of 2018.
- Homes in San Diego County continue to sell at a faster rate than other markets in the region. In the second quarter it took an average of just 29 days to sell a home. I would note that this is 5 more days than it took a year ago.
- Market time is increasing, which may concern some, but it is simply a move back to historic averages.

CONCLUSIONS
The speedometer reflects the state of the region’s real estate market using housing inventory, price gains, home sales, interest rates, and larger economic factors.
Rising inventory levels, and affordability concerns in many markets will likely lead to slower price growth as we move through 2019. That said, mortgage rates are still very attractive, and this can offset affordability issues to some degree.
Given rising inventories and slower price growth, I have moved the needle just a little more toward buyers, though it still remains a sellers market.

As Chief Economist for Windermere Real Estate, Matthew Gardner is responsible for analyzing and interpreting economic data and its impact on the real estate market on both a local and national level. Matthew has over 30 years of professional experience both in the U.S. and U.K.
In addition to his day-to-day responsibilities, Matthew sits on the Washington State Governors Council of Economic Advisors; chairs the Board of Trustees at the Washington Center for Real Estate Research at the University of Washington; and is an Advisory Board Member at the Runstad Center for Real Estate Studies at the University of Washington where he also lectures in real estate economics.

![]()

Windermere Living - Spring 2019
In this Spring 2019 issue of the Windermere Living magazine you will learn about decluttering your home, edible flowers, five talented designers creative processes, and much more.
Windermere Living is an exclusive listings magazine published by Windermere Real Estate. Read the online version by clicking on the image below.

Q1 Southern California Real Estate Market Update | Gardner Report
The following analysis of the Southern California real estate market is provided by Windermere Real Estate Chief Economist Matthew Gardner. We hope that this information may assist you with making better-informed real estate decisions. For further information about the housing market in your area, please don’t hesitate to contact your Windermere agent.
ECONOMIC OVERVIEW
The counties covered by this report — Los Angeles, San Diego, San Bernardino, Orange, and Riverside — added 165,000 new jobs between February 2018 and February 2019. This represents an annual growth rate of 1.7%. In the same timeframe, the unemployment rate dropped from 4.4% to 3.9%. Employment growth in Southern California picked up a little in the late winter. Los Angeles County led the way, adding 96,500 new jobs. My 2019 forecast for employment in Southern California is for continued growth at around 1.5%.
HOME SALES
- There were 34,142 home sales in the first quarter of 2019. This was a drop of 12.4% from the same period in 2018 and 13.9% lower than the final quarter of last year
- Pending home sales (an indicator of future closings) were just 2.8% lower than during the same period a year ago, but down 18% compared to the fourth quarter of 2018. This suggests that second-quarter sales are likely to disappoint.
- Home sales dropped across the board, but the most noticeable decline was again in Orange County, which fell by 15.2%. This drop is probably temporary and was more than likely driven by the 49% increase in inventory and high home prices. The smallest drop was in the more affordable Riverside County.
- There was an average of 37,641 active listings in the first quarter — up 30.5% from a year ago.

HOME PRICES
 Year-over-year, average prices in the region rose a very modest .3% and were 2.4% lower than in the fourth quarter of 2018.
- Affordability remains an issue in most of the Southern California counties contained in this report, which, in concert with growing inventory, will likely continue to limit home price growth.
- Price growth was varied. Riverside County showed the greatest annual appreciation (+4.3%). Average home prices dropped 1.4% in Orange County.
- On a year-over-year basis, I expect to see home prices continue to rise through 2019, but the rate of growth will be more modest than the market has seen in several years.

DAYS ON MARKET
- The average time it took to sell a home in the region was 53 days. This is a 10-day increase compared to the first quarter of 2018, and eight days more than in the fourth quarter of 2018.
- All markets saw an increase in the time it took to sell a house in the first quarter of this year compared to both the first and fourth quarters of 2018.
- Homes in San Diego County continue to sell at a faster rate than other markets in the region. In the first quarter, it took an average of 37 days to sell a home, which is eight days more than it took a year ago.
- Market time is increasing, which may concern some; however, it is simply a move back to normal averages.

CONCLUSIONS
 The speedometer reflects the state of the region’s real estate market using housing inventory, price gains, home sales, interest rates, and larger economic factors.
The Southern California economy saw a bit of a boost in early 2019, which is good news. But rising inventory levels and low affordability in many markets will lead to slower price growth. Affordability remains a significant issue and I will be watching proposed legislation, such as Senate Bill 50, to see whether there is enough interest in addressing this obstacle to home ownership.
Rising inventories and slower price growth has led me to move the needle a little further toward buyers.
As Chief Economist for Windermere Real Estate, Matthew Gardner is responsible for analyzing and interpreting economic data and its impact on the real estate market on both a local and national level. Matthew has over 30 years of professional experience both in the U.S. and U.K.
In addition to his day-to-day responsibilities, Matthew sits on the Washington State Governors Council of Economic Advisors; chairs the Board of Trustees at the Washington Center for Real Estate Research at the University of Washington; and is an Advisory Board Member at the Runstad Center for Real Estate Studies at the University of Washington where he also lectures in real estate economics.

![]()